Bitcoin hit a low of $57,749 on 1 July, before bouncing and reclaiming $61,000 the next day. Since then, the price has traded somewhere between $61,000 and $67,000 a coin. Here are three charts that suggest bitcoin could be building a base before a potential leg higher.
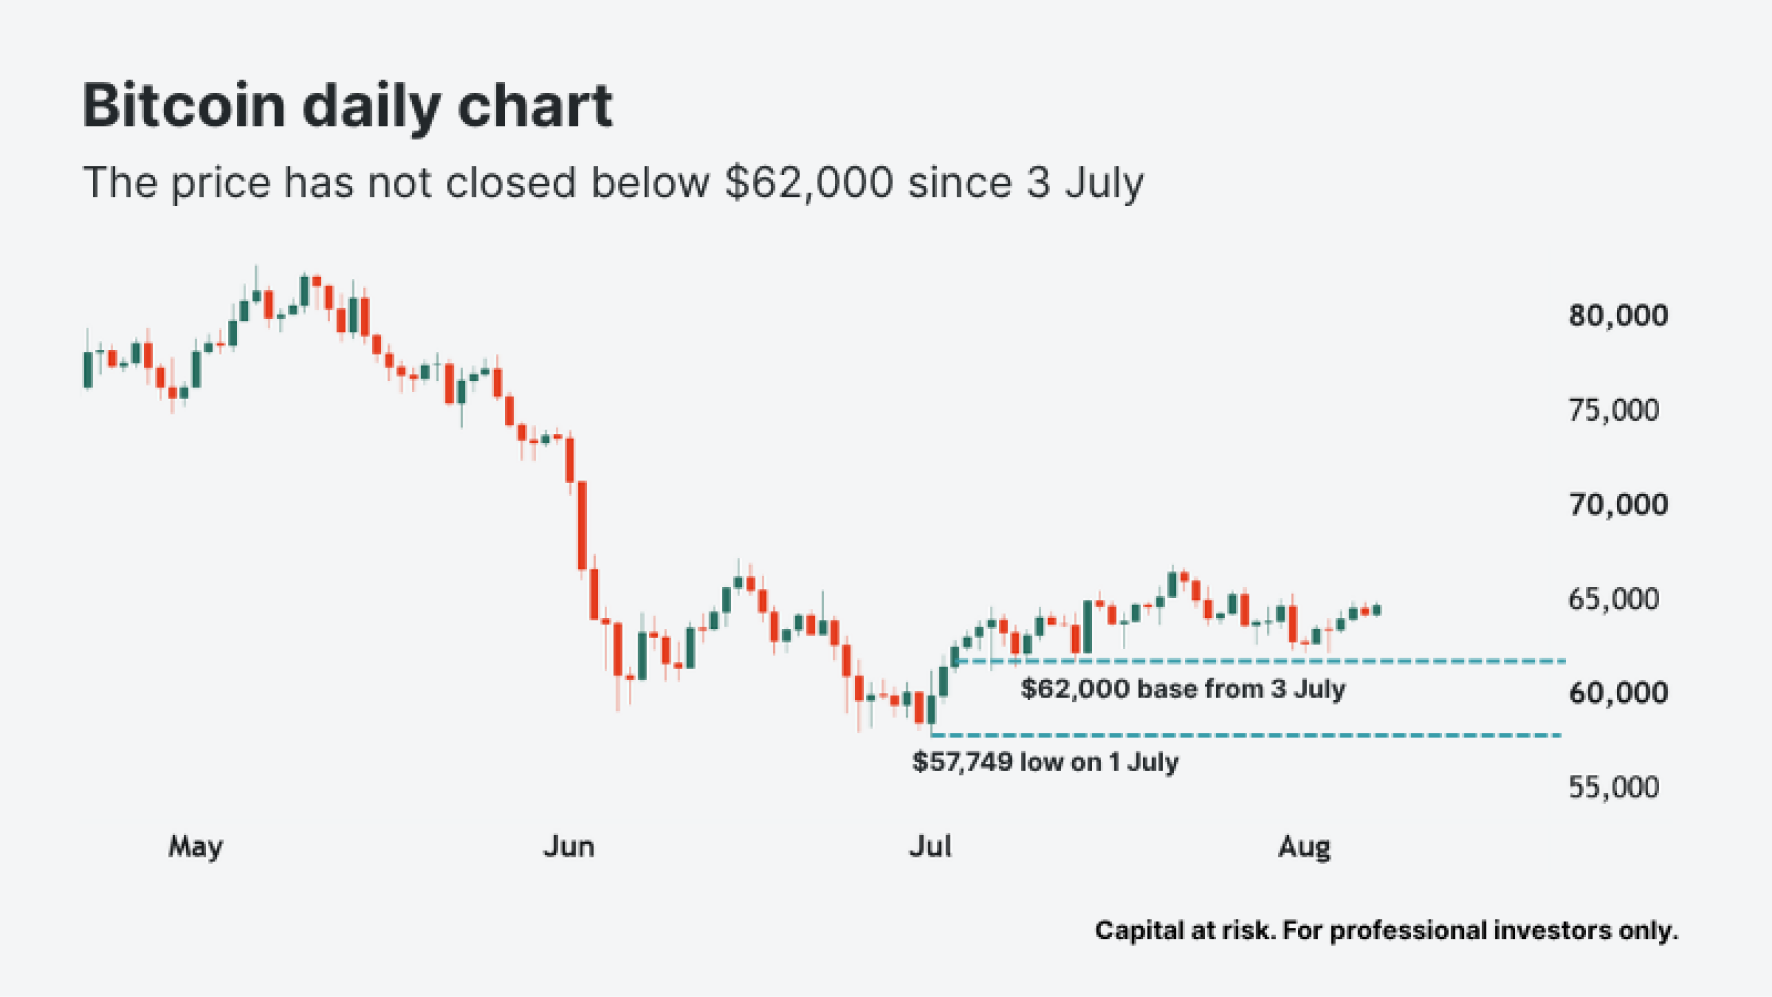
Chart 1: Bitcoin hasn't closed below $62,000 since 3 July
Each red or green price candle in the chart below represents one day of price action for bitcoin. The chart shows how quickly buyers took control after the 1 July low of $57,749. 2 July closed above $61,000, and the day after that the floor moved up again. Every daily candle has closed above $62,000 since 3 July (or five weeks of trading).
Source: TradingView | As of 7 August 2026
In June, we mapped out three support levels converging around $58,000. The lowest of them was the 61.8% Fibonacci retracement at $57,778, and bitcoin undercut it by $29.
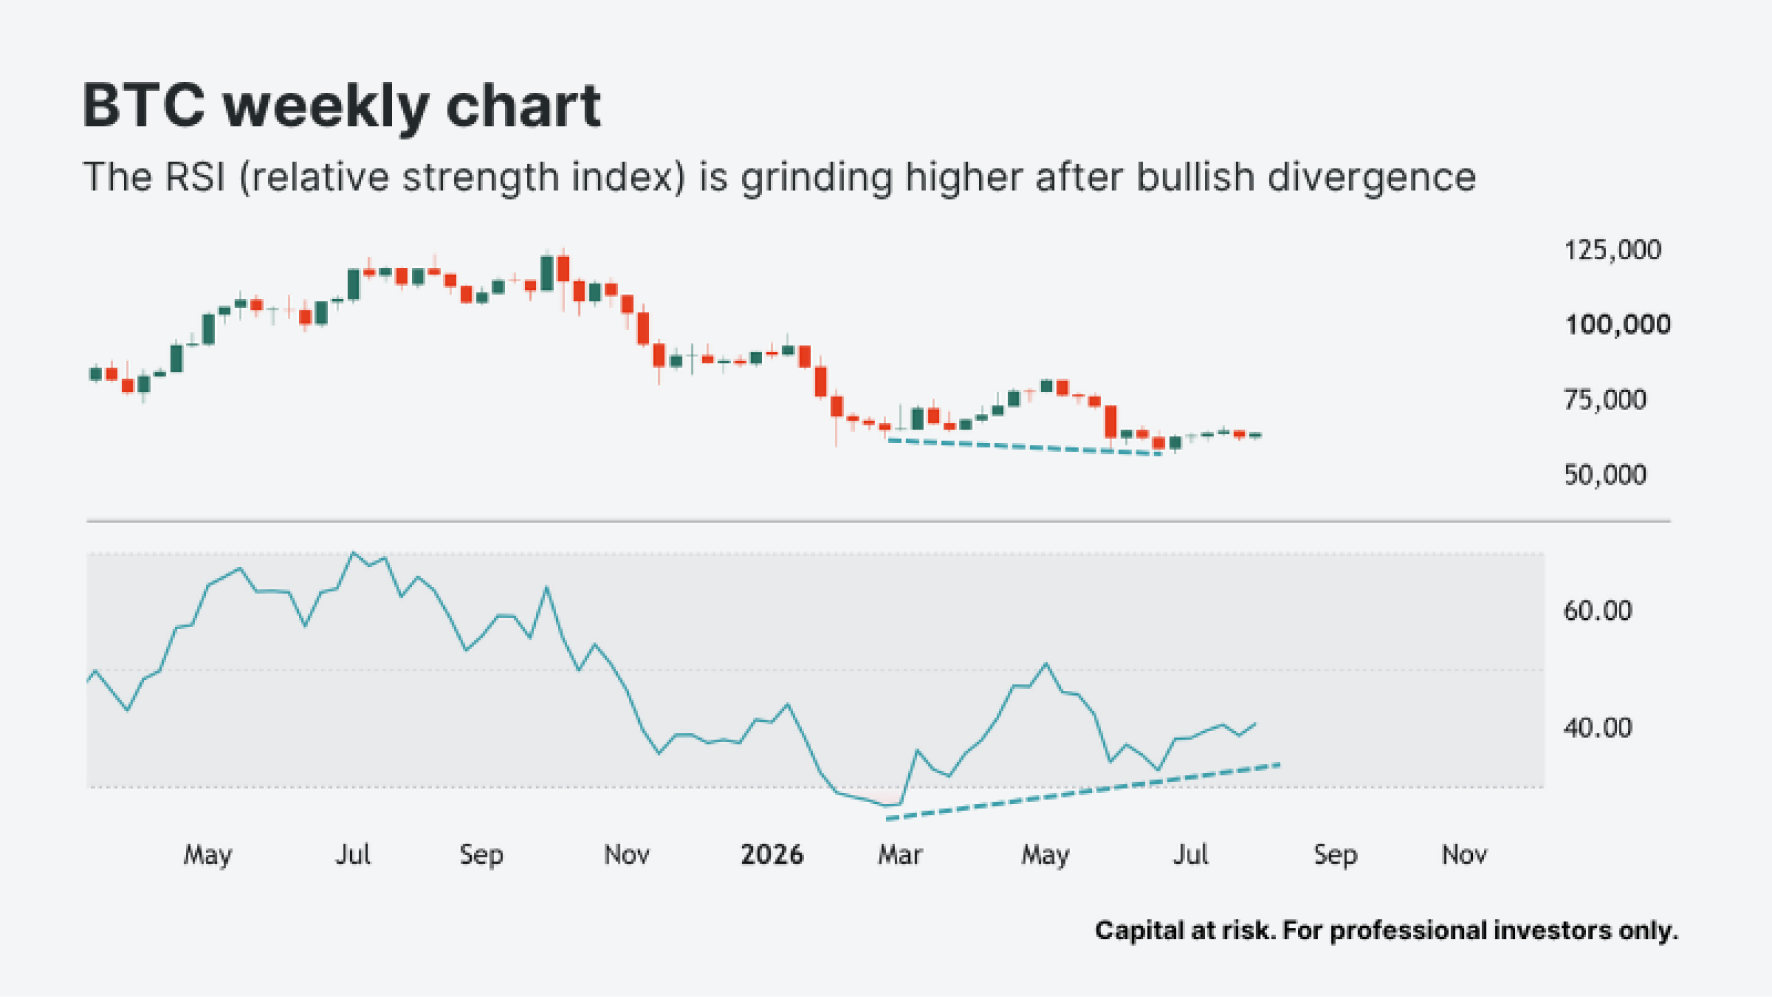
Chart 2: The weekly RSI is grinding higher
We can now zoom out to the weekly time frame (each candle is one week). The relative strength index (RSI) measures the average gains of "up" weeks against the average losses of "down" weeks, over the past 14 weeks. Notice how it's gradually moved higher over the past few weeks, while bitcoin traded mostly sideways. That means the up moves are getting relatively bigger, so buyers are gaining strength over sellers (according to the indicator).
Source: TradingView | As of 7 August 2026
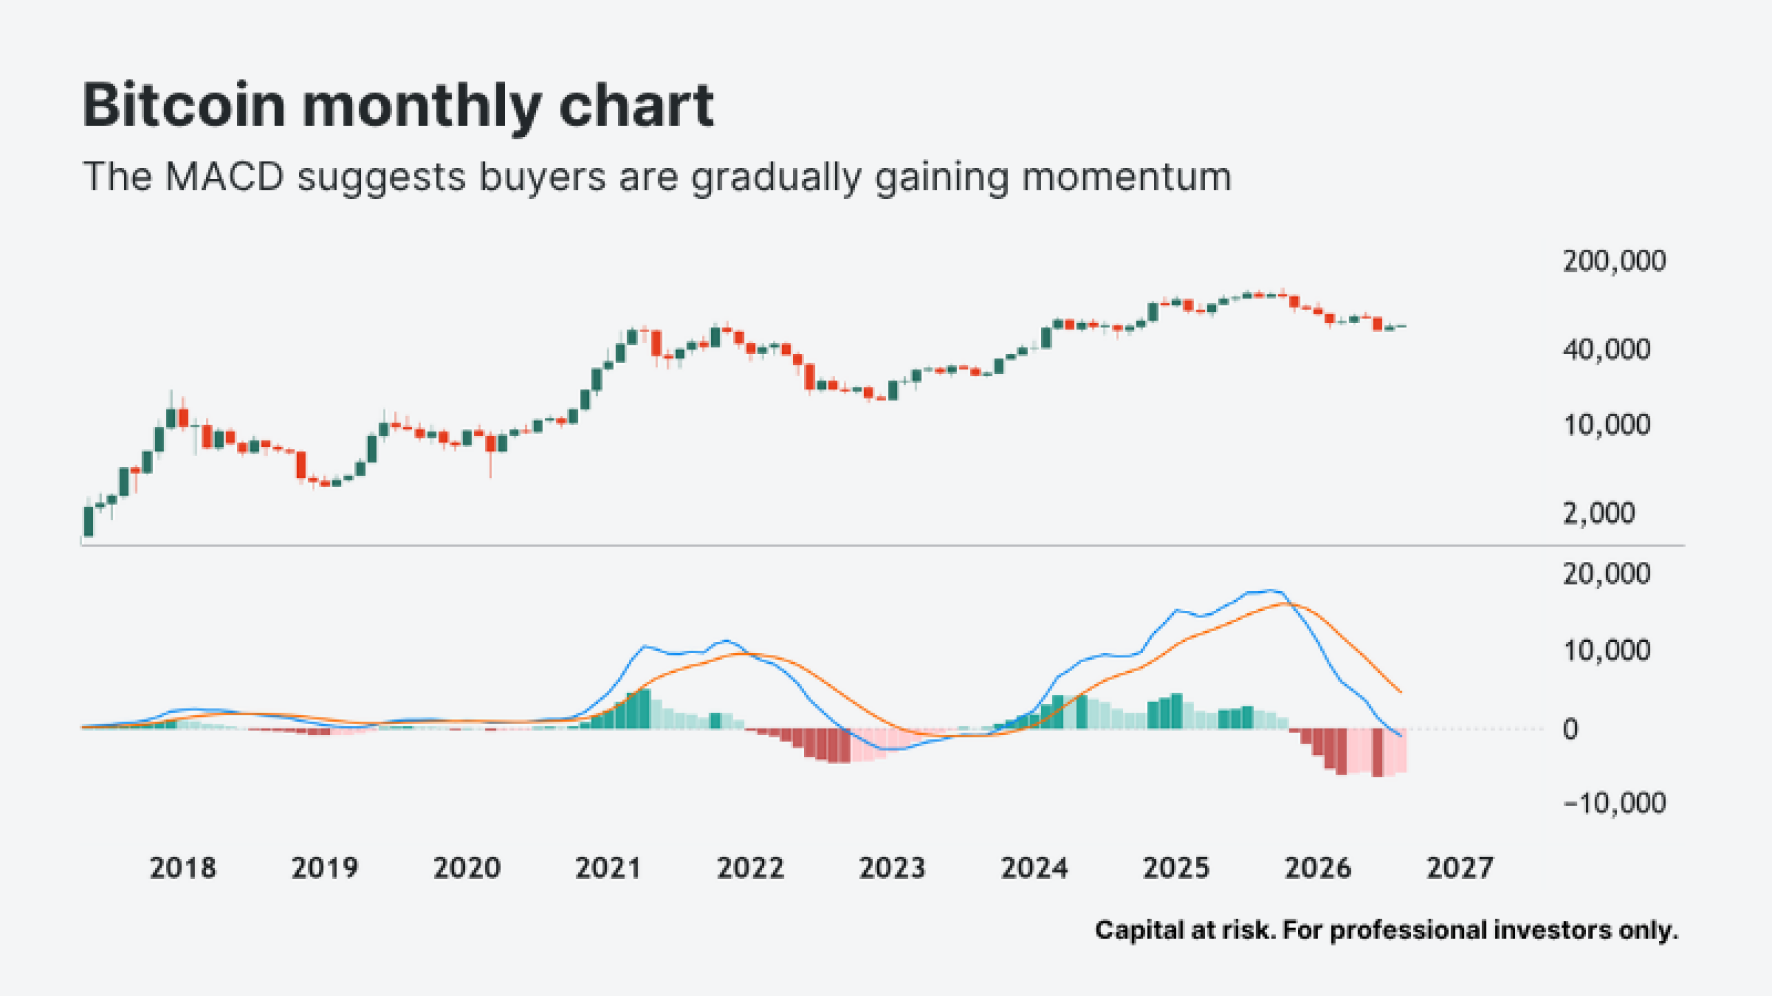
Chart 3: The monthly MACD bars are getting shorter and "less red"
Zooming out again, each candle here is one month. The MACD (moving average convergence divergence) compares bitcoin's 12-month moving average with its 26-month one, and plots that difference as the blue line. The "more red" the bars, the faster that blue line is falling. Those bars have started to get shorter and "less red". So the blue line's decline is slowing down. In plain English: seller momentum is waning and buyer momentum is gaining (according to the indicator).
Source: TradingView | As of 7 August 2026
Leverage Shares offers 3X long and short Bitcoin ETPs, which aim to provide three times the daily move in bitcoin, before fees. Capital at risk.
Key takeaways
Bitcoin is down around 30% and Ethereum around 42% so far in 2026. Our short ETPs gained around 45% and 57%, while the long ETPs lost around 79% and 89%.
The short ETPs compounded their gains in fast declines, and the spring bounce pulled some back. The daily path drove every result.
These products typically suit short-term trading. Held longer, returns may drift well away from three times the coin's move.