The US Senate voted down the Clarity Act on 15 September. Then the US Federal Reserve raised interest rates the next day – its first hike since 2023. It said inflation is still too high, with oil prices partly to blame. Yet despite all that "bad news", bitcoin still finished that week at a higher price.
Back in June, we mapped a support zone between $58,000 and $62,000. Bitcoin bottomed on 1 July at $57,749 (TradingView, Bitcoin all time history index). Then in August, we showed three signs bitcoin was building a base. Here are three charts that show why we think the base is complete – and a new bitcoin bull market has started.
1. Bitcoin has made its first higher high since the top
Source: TradingView (Bitcoin all time history index), as of 25 September 2026.
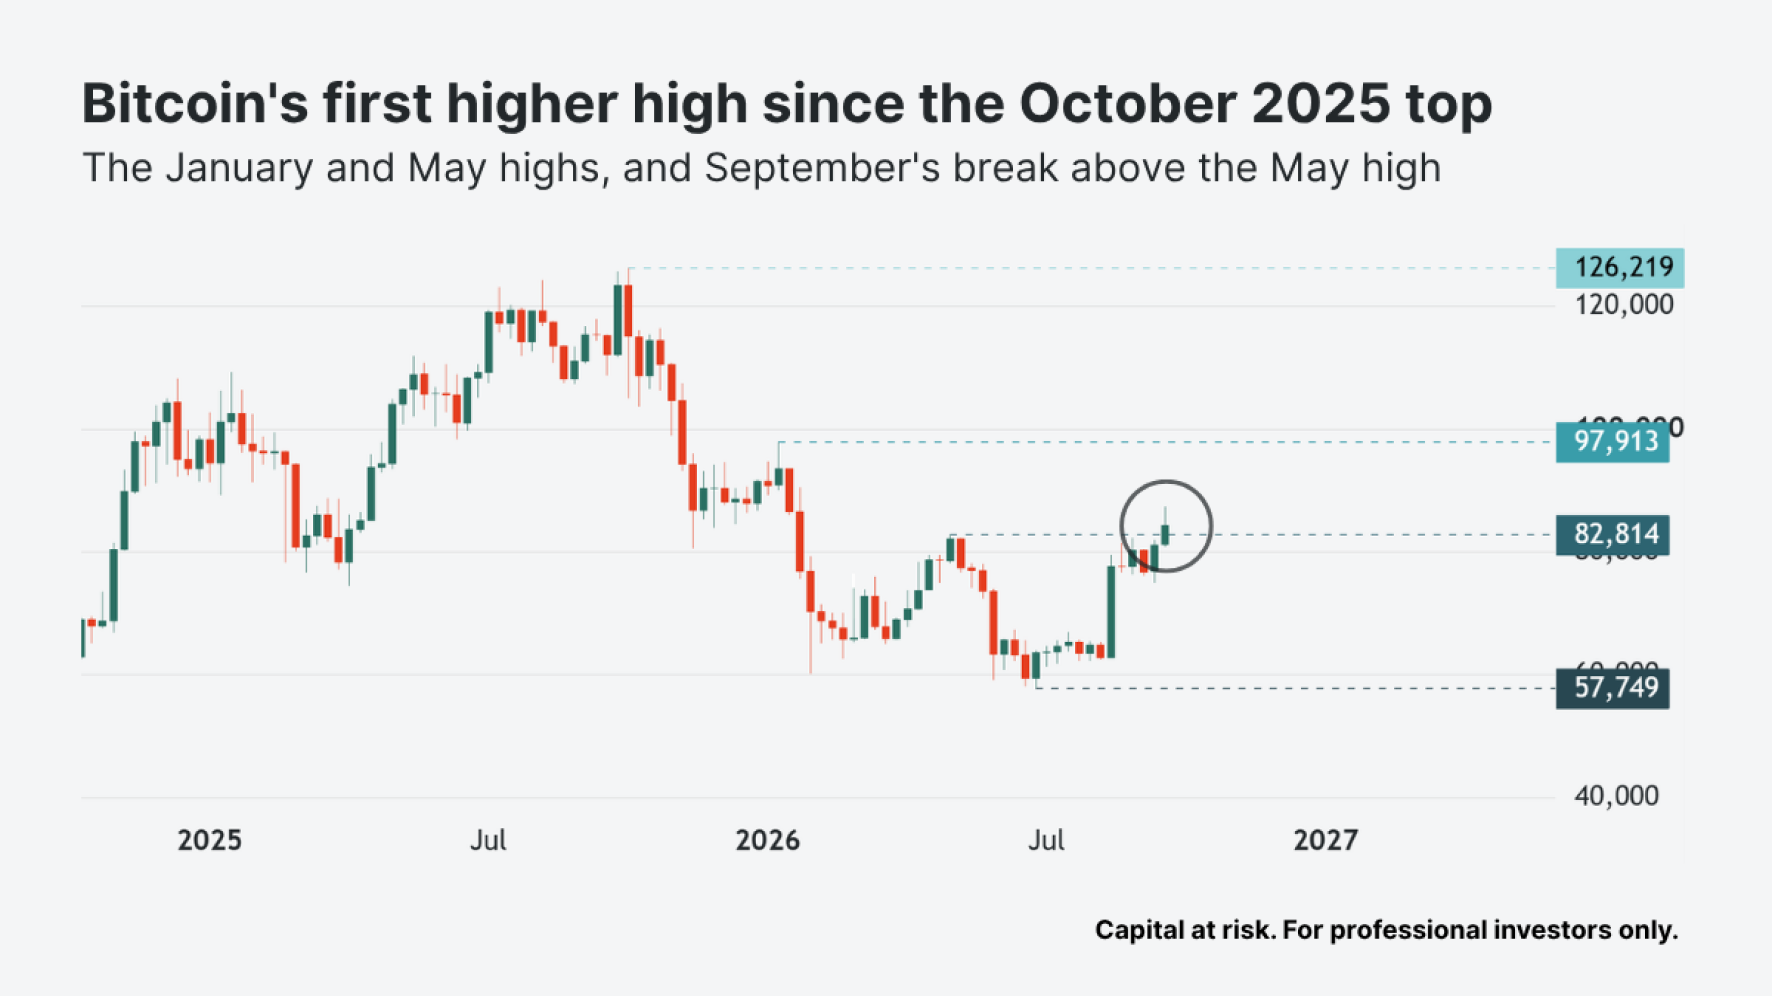
Technical analysts define an uptrend as a series of higher highs and higher lows, and a downtrend as the reverse. Since the October 2025 high of $126,219, every bitcoin rally has topped out below the last. The January bounce failed at around $97,913, and the May rally reversed at $82,814. That's a downtrend by definition.
This month, though, bitcoin broke above that May high. That's the first higher high since the top, and it's the simplest sign that the trend has changed. In a bull market, the price makes higher highs.
If bitcoin were to pull back – and then make a higher low – that would offer up even more confirmation of the uptrend. And if it doesn't pull back (and keeps rallying), that's bullish anyway. A weekly close back below $82,814 would put this particular breakout in doubt, but not the bull market on its own. That comes down to the next chart.
2. Bitcoin has closed back above its 50-week moving average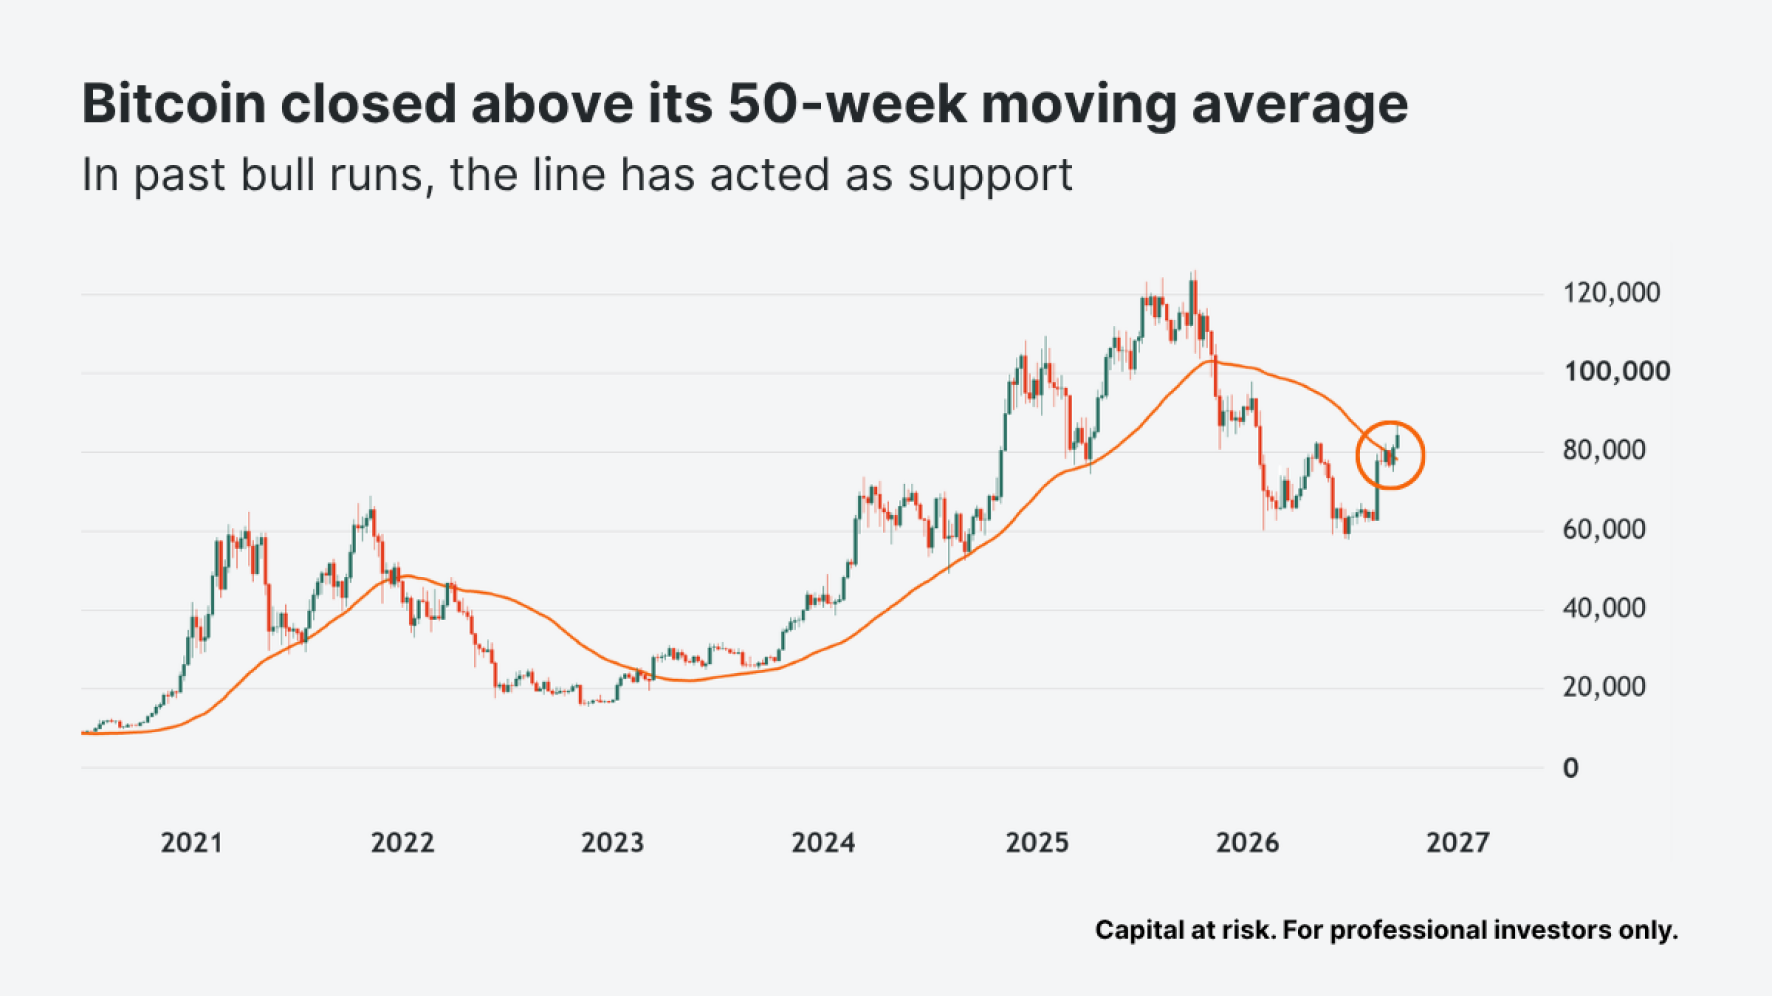
Source: TradingView (Bitcoin all time history index), as of 25 September 2026.
The 50-week moving average is bitcoin's average weekly closing price over the past 50 weeks (roughly a year). Traders watch it because it tends to separate bull markets from bear markets. In the last bitcoin bull run, the price held above the line and bounced off it on every major drop. It also held the summer 2021 sell-off the same way. When bitcoin lost the line in November 2025, the bear market took hold.
But on 20 September, bitcoin closed the week above the 50-week average for the first time since November 2025. To remain in a bull market, it now just needs to hold it on a weekly closing basis.
3. The weekly RSI has moved into the “bullish control zone” 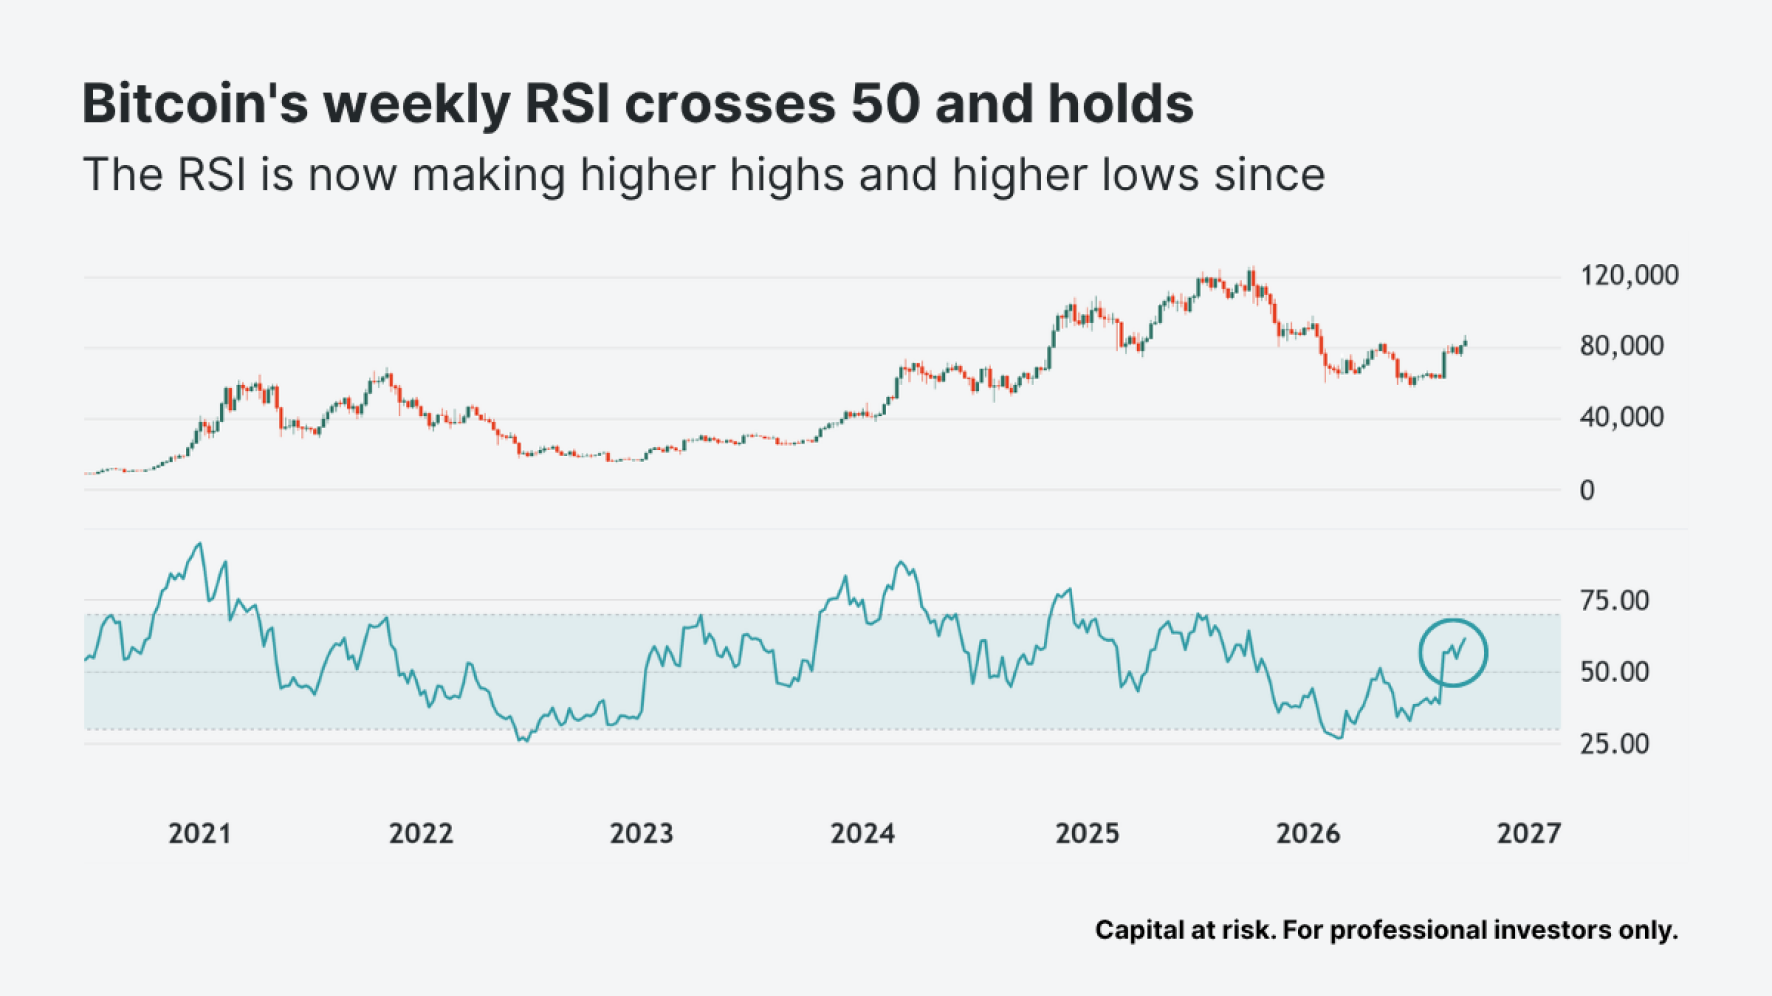
Source: TradingView (Bitcoin all time history index), as of 25 September 2026.
The relative strength index (RSI) compares the size of bitcoin's up weeks with the size of its down weeks over the past 14 weeks. A reading above 50 means the average up week has been bigger than the average down week. In plain English, buyers have gained strength over sellers.
In August, we showed the weekly RSI grinding higher while the price stayed flat. It was still below 50 then. Later that month, it crossed back above 50 – into what's known as the "bullish control zone". Notice in the chart how the RSI briefly pierced above 50 in the May rally earlier this year – but failed. The second time, however, it rose above 50 and stayed there.
The weekly RSI is now in a clear uptrend of its own, with higher highs and higher lows.
For now, bitcoin is in a bull market on all three measures. The burden of proof has shifted to the bears.
Leverage Shares offers 3X long and short Bitcoin ETPs, which aim to provide three times the daily move in bitcoin, before fees. Capital at risk.
Key takeaways
Bitcoin broke above its May high of $82,814 in September, its first higher high since the October 2025 top. A higher low would add confirmation; a weekly close back below $82,814 would put this breakout in doubt, but not the bull market on its own.
Bitcoin closed the week of 20 September above its 50-week moving average for the first time since November 2025. To remain in a bull market, it needs to hold that line on a weekly closing basis.
The weekly RSI crossed back above 50 in August and stayed there, unlike its failed attempt in May. It's now making higher highs and higher lows of its own.