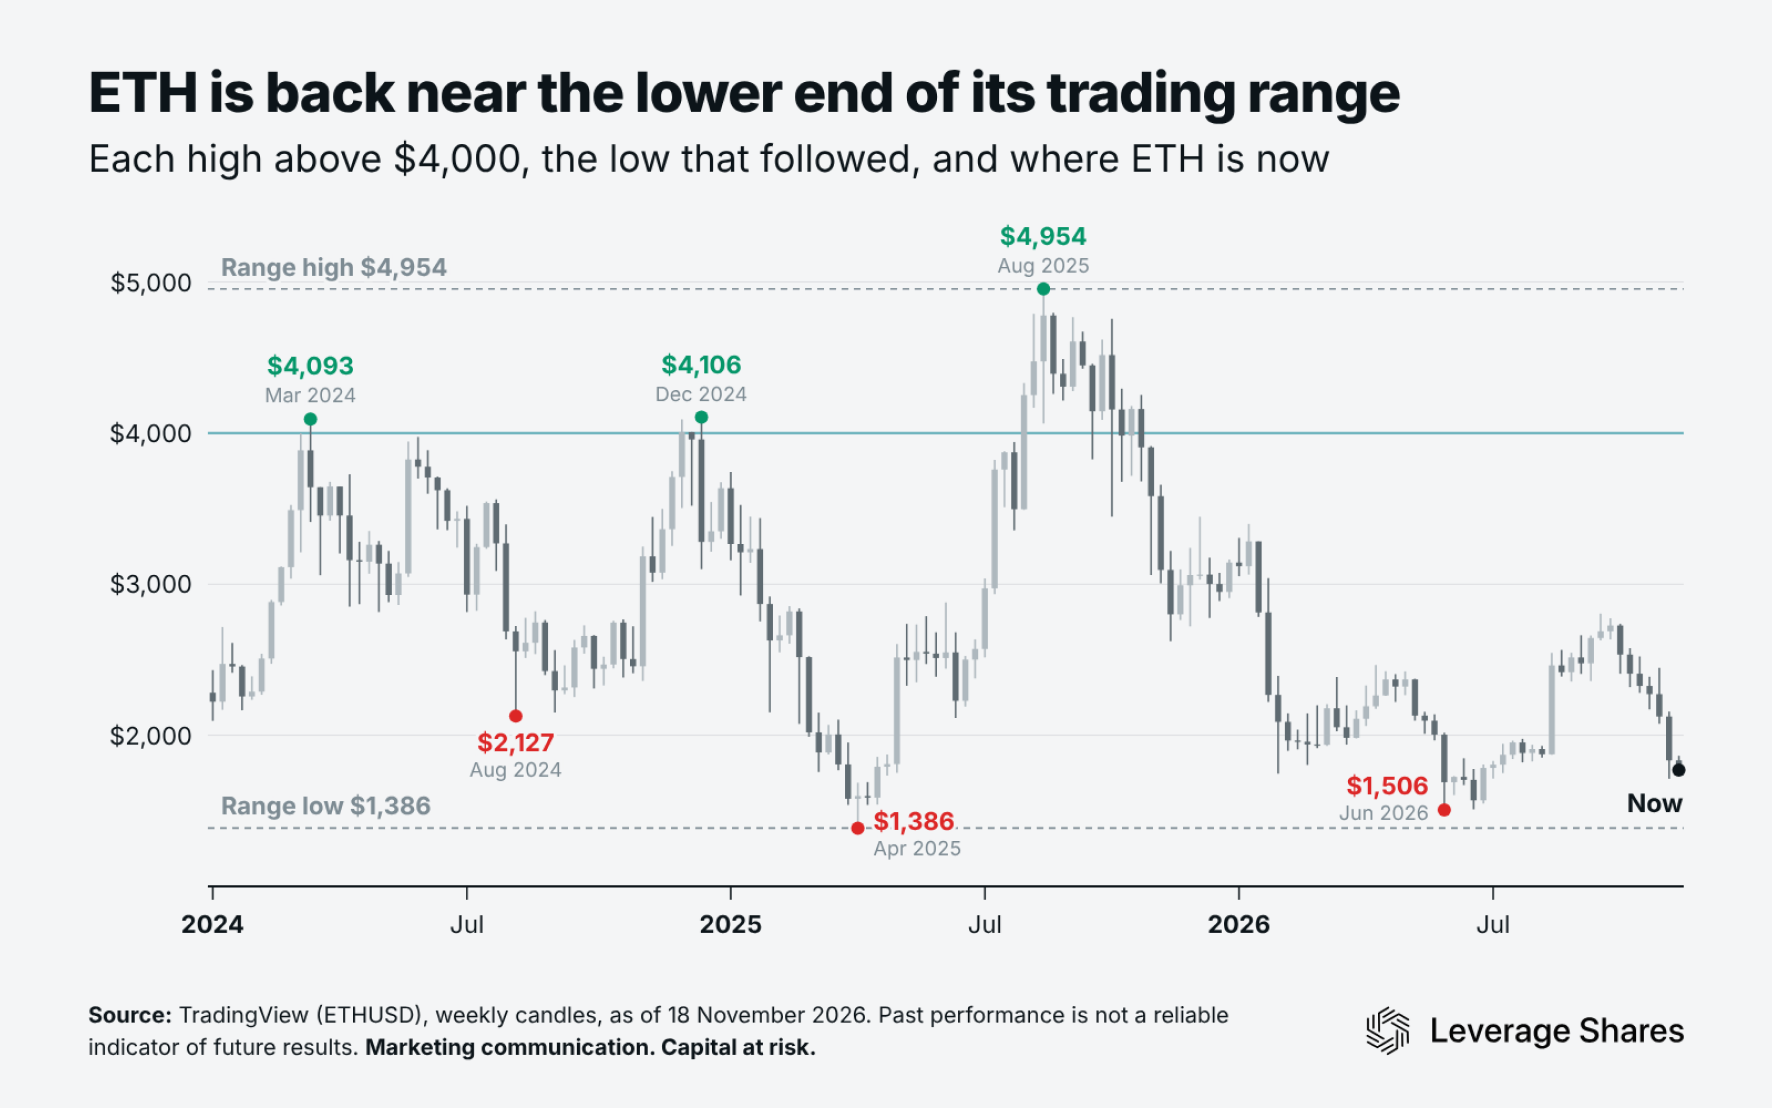
Ethereum (ETH) has been a frustrating investment to hold – it now trades lower than it did three years ago. But swing traders have had plenty to work with. Since its March 2024 high, ETH has stayed between about $1,400 and $4,950. And now, it’s back near the lower end of that trading range.
ETH is down about 37% from its September high, and it's testing a key support zone. That's left its daily relative strength index (RSI) oversold, and the price far below its 200-week moving average. On both gauges, ETH has rarely been this stretched. So we looked at what it did next in the past.
The Ethereum trading range since March 2024
The chart below shows the Ethereum trading range since March 2024, when ETH broke above $4,000 for the first time since 2021. ETH rallied above $4,000 again in December 2024, and hit its all-time high $4,954 in August 2025. ETH set the range low of $1,386 in April 2025. From there, it rallied 258% to that record. In June 2026, it fell back to $1,506 – still above April 2025's low.
So instead of one long trend, ETH has produced big moves in both directions. That’s worked out well for long and short swing traders who’ve been able to time the turns.
So is this a turning point for ETH?
ETH is now near the bottom of its trading range – and the pullback could be stretched according to three technical indicators.
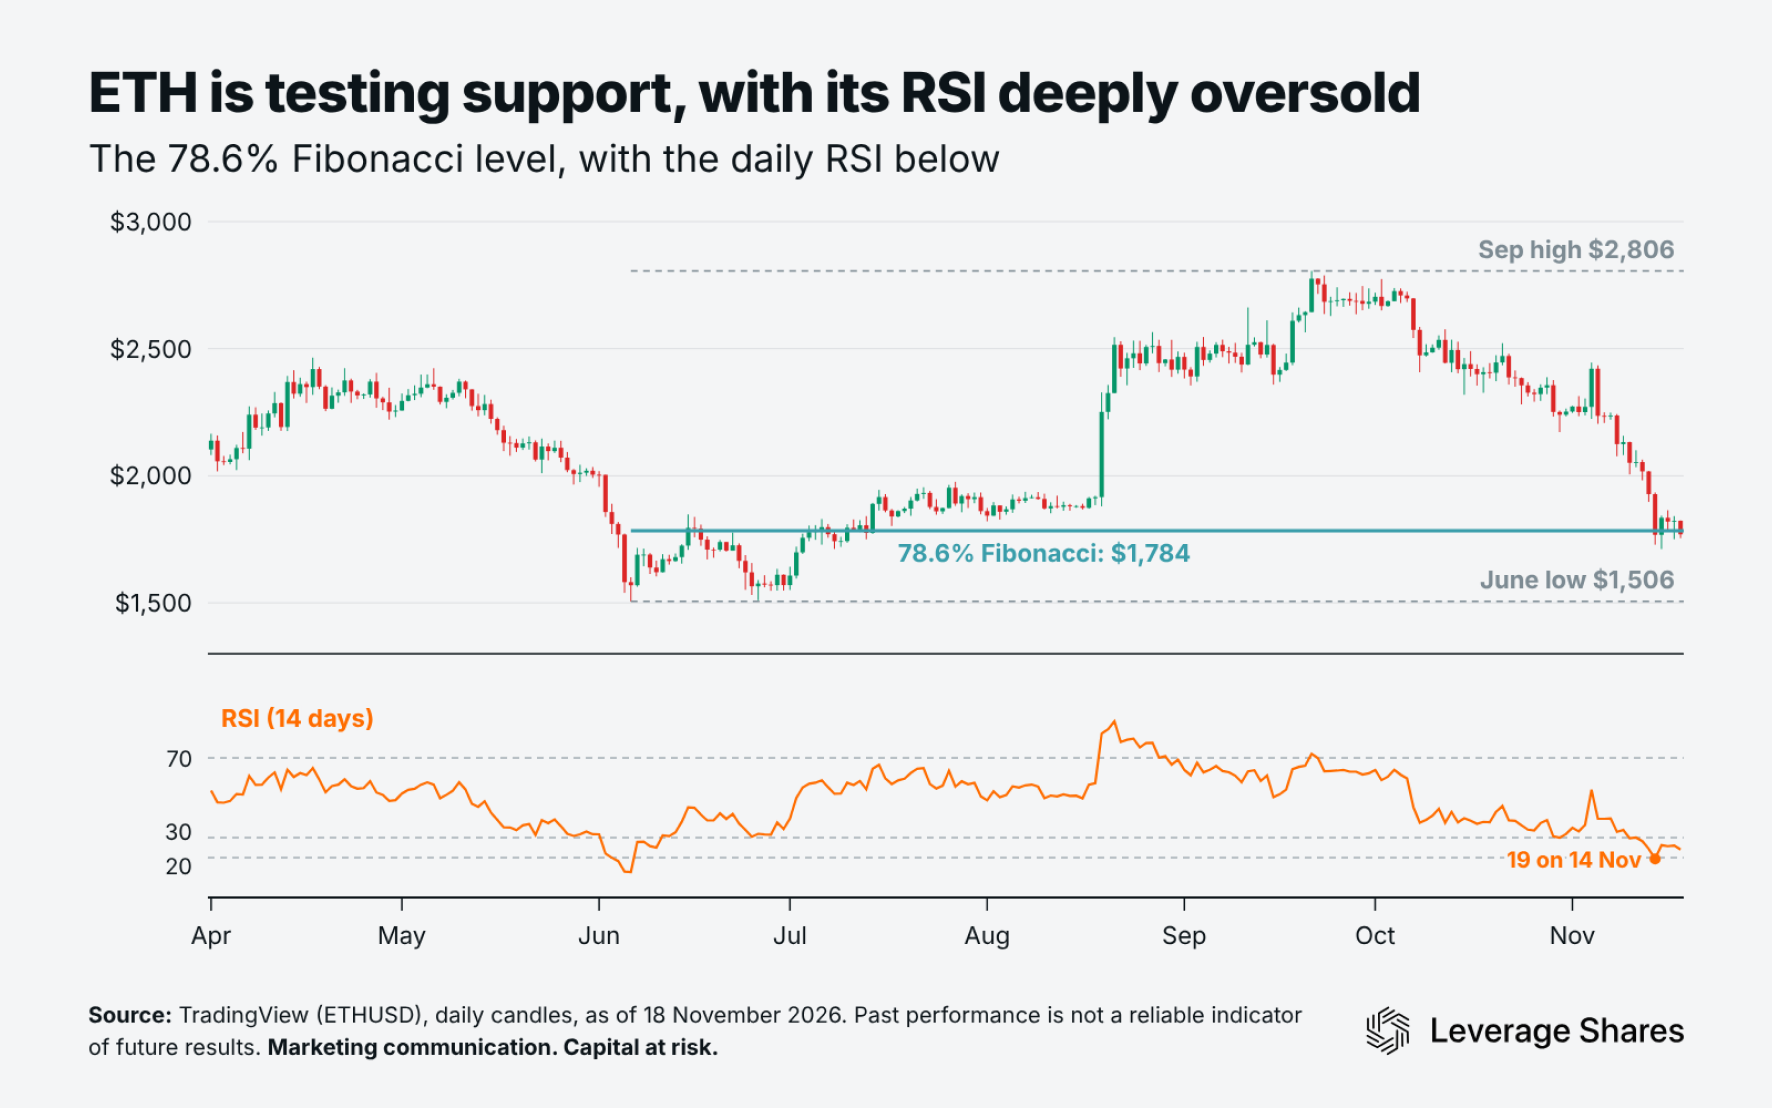
1. ETH is testing a support zone. In July, we made the case for a long bias on ETH near $1,500. It then rallied to $2,806 in September, but it's since given back about 80% of that move. Traders use Fibonacci retracements to measure pullbacks, and 78.6% is the deepest common level. Here, it's around $1,780 (teal line), and ETH is currently trading around that zone.
2. The daily RSI is deeply oversold. The RSI (orange) tracks the speed of recent price moves. A reading below 30 counts as oversold, and ETH's daily RSI hit 19 in mid-November. Readings below 20 are rare. Our analysis of TradingView data found just seven other readings like this since 2015. In six of those seven cases, ETH was higher three months later.
3. The price is far below its 200-week moving average. This moving average tracks ETH's average weekly closing price over the past 200 weeks. ETH now trades about 31% below that line – and it's only been 30% or more below four other times. Each time, we measured from the first week it closed 30% or more below the line. Three months later, the price was between 49% and 97% higher.
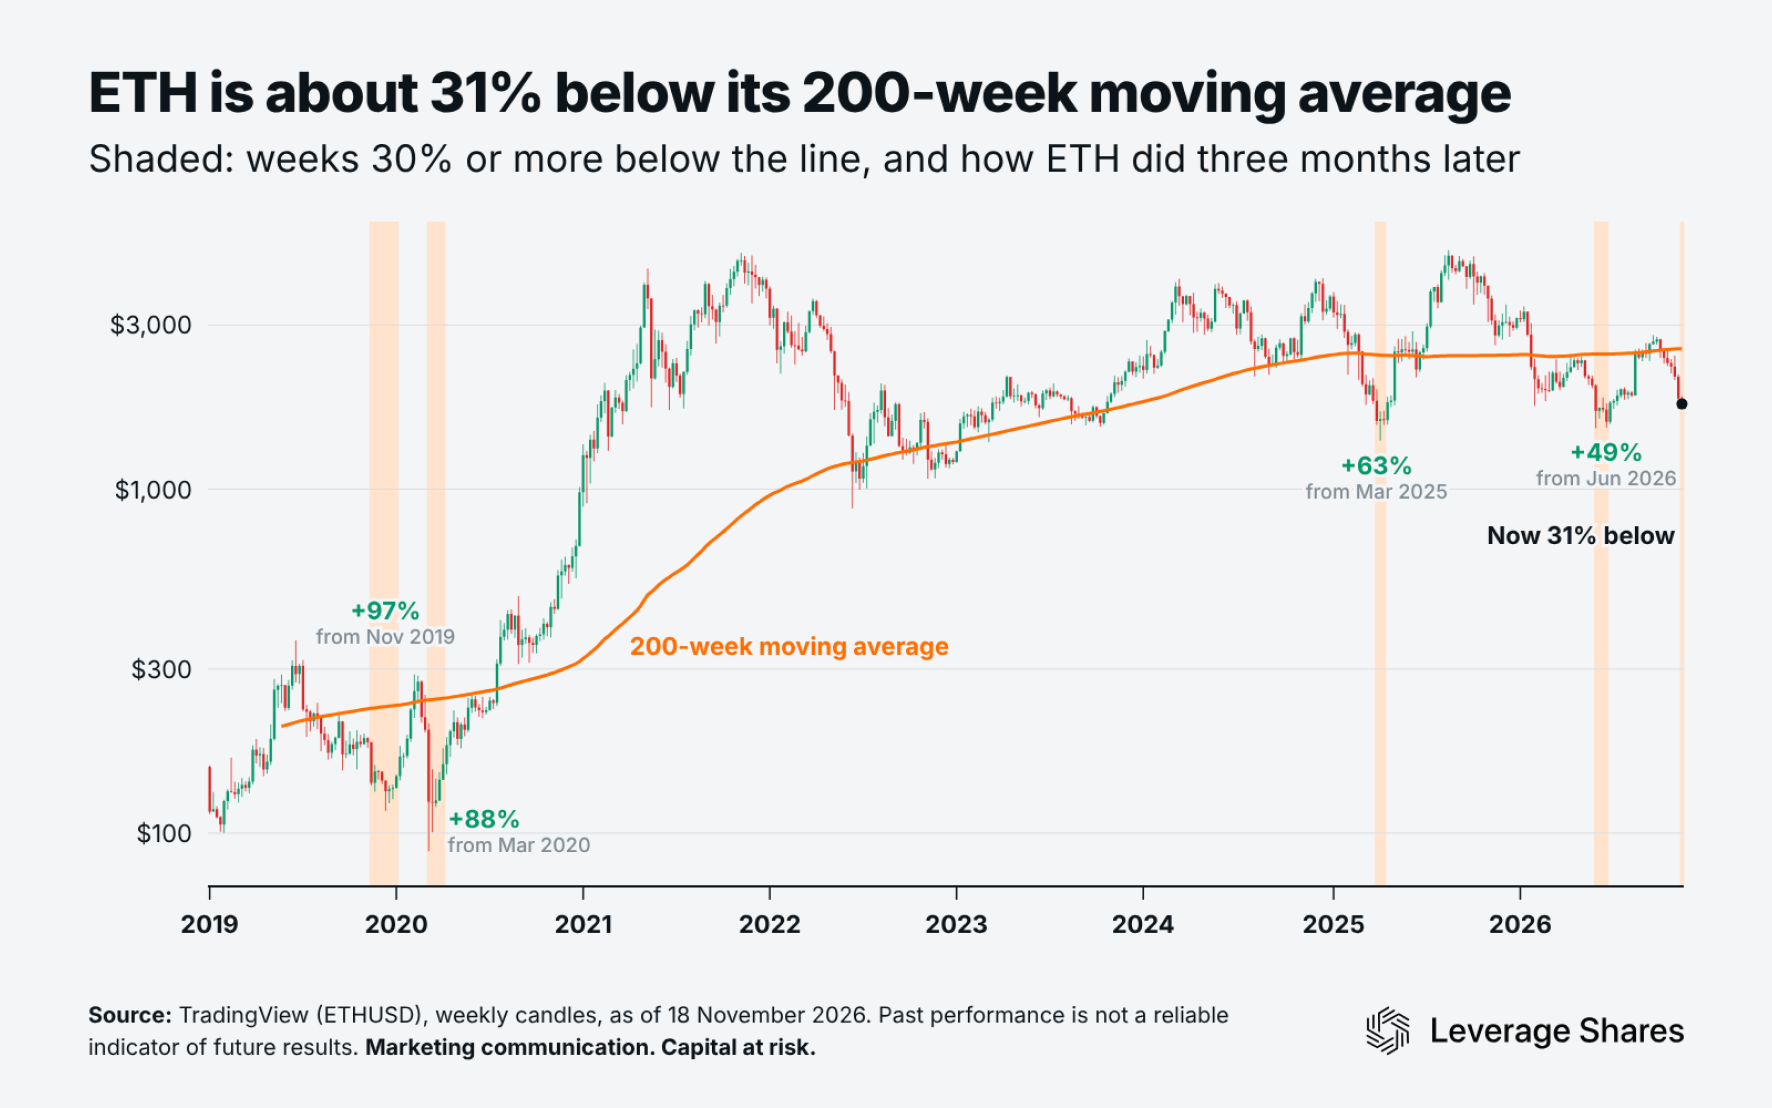
These are small samples, so nothing's guaranteed. But in our view, the odds favour a bounce over the coming months – even if ETH dips a bit further first.
Leverage Shares offers 3x long and short Ethereum ETPs, which aim to provide three times the daily move in ether, or three times the inverse, before fees. Capital at risk.
Key takeaways
- ETH trades lower than it did three years ago. But since March 2024, it's moved between about $1,400 and $4,950, and it's now back near the lower end.
- ETH is testing support near $1,780, and its daily RSI is deeply oversold. In six of the seven previous cases, ETH was higher three months later.
- ETH is about 31% below its 200-week moving average. It's only been 30% or more below four times before, and it was higher three months later each time. Past performance is not a reliable indicator of future results.