After a historic run to $126,110 and a bruising retracement toward $60,000, Bitcoin enters 2026 at a crossroads. Will the bear phase extend further, or will Bitcoin consolidate before its next structural advance?
From Euphoria to Exhaustion
The latest Bitcoin bounce to above $72,200 appears to be short-lived and the largest cryptocurrency finds itself in a familiar yet uncomfortable position: post-peak uncertainty.
Since peaking in October 2025 at $126,110, Bitcoin has bled lower to $60,246 without a singular shock event to blame. That slow erosion of confidence can be more destabilizing than a violent crash. There is no FTX, no systemic implosion. Just fading momentum.
And yet, compared with prior cycles, the damage appears contained. Bitcoin fell more than 52% from its all-time high to its recent low, which is painful, but far from the 75%-85% drawdowns that defined earlier crypto winters. Greater liquidity, deeper derivatives markets, and structurally embedded institutional participation have fundamentally changed market structure.
The Four-Year Cycle Points to a Major Turning Point in 2026
The central debate heading into 2026 is whether Bitcoin’s historically reliable four-year halving cycle still governs price action.
The last Bitcoin halving was in April 2024, reducing mining rewards to 3.125 Bitcoins. Historically, halvings have preceded powerful bull markets, which were followed by sharp retracements. The duration of these bull markets has typically been about one year and five to six months from the date of the halving to the peak before the downturn, while the subsequent bear markets have lasted approximately one year. Time-based projections suggest Bitcoin have peaked in October 2025 (exactly one year and six months after the April 2024 halving), which is consistent with prior cycles.
In terms of price action, as Bitcoin’s price has risen over the years, the percentage gain of each subsequent bull market following the halvings has decreased significantly, while the following bear markets have typically declined between 75% and 85%.
Now the big question is: since each bull trend following a halving has so far lasted about a year and a half, and each subsequent bear trend has lasted one year and declined more than 75%, if we extrapolate this pattern to the latest cycle, can we conclude that Bitcoin is likely to fall to $30,000 by October 2026? This represents a downtrend declining 75% from its all-time high and lasting a year.
While this analogy would fit perfectly with the timing and magnitude of previous major down trends, we should make an important caveat. First, the last bull run was far more muted than previous ones. Second, although each previous down trend has declined significantly in percentage terms, it has never fallen below the price of Bitcoin on the date of halving, on a weekly closing basis. These facts are encouraging for the bulls and suggests that, if there is consistency with prior cycles, there is a fairly good probability that Bitcoin may have bottomed at $60,000 last week. Another encouraging sign supporting the bullish case is the current level of the weekly Relative Strength Index (RSI). In prior cycles, the major bottoms of the downturns coincided with RSI readings between 26% and 29%, while today’s weekly RSI stands at 28%. However, a bullish divergence between the price and the RSI could still form before the down trend reverses (as it did in 2022) implying that Bitcoin could decline further from here. Nonetheless, only one bottom since the creation of Bitcoin was accompanied by a bullish divergence on the weekly chart. All of these suggests that Bitcoin is either at the beginning, or not far from, forming a major bottom.
In a worst-case scenario, we could see Bitcoin declining to $50,000 by October 2026, but only if support at $60,000 gets broken. If this support level holds over the coming months, we can then more confidently declare that the downtrend from the October 2025 high is over with Bitcoin’s price action likely to consolidate for several months.
This cycle differs in important ways. Unlike prior peaks, Bitcoin never reached the euphoric extremes typically associated with cycle tops, suggesting that the current downturn is unlikely to match the magnitude of previous declines.
So, the four-year rhythm may still be intact, but it is increasingly overlaid by institutional ETF flows that compress volatility and complicate historical analogies.
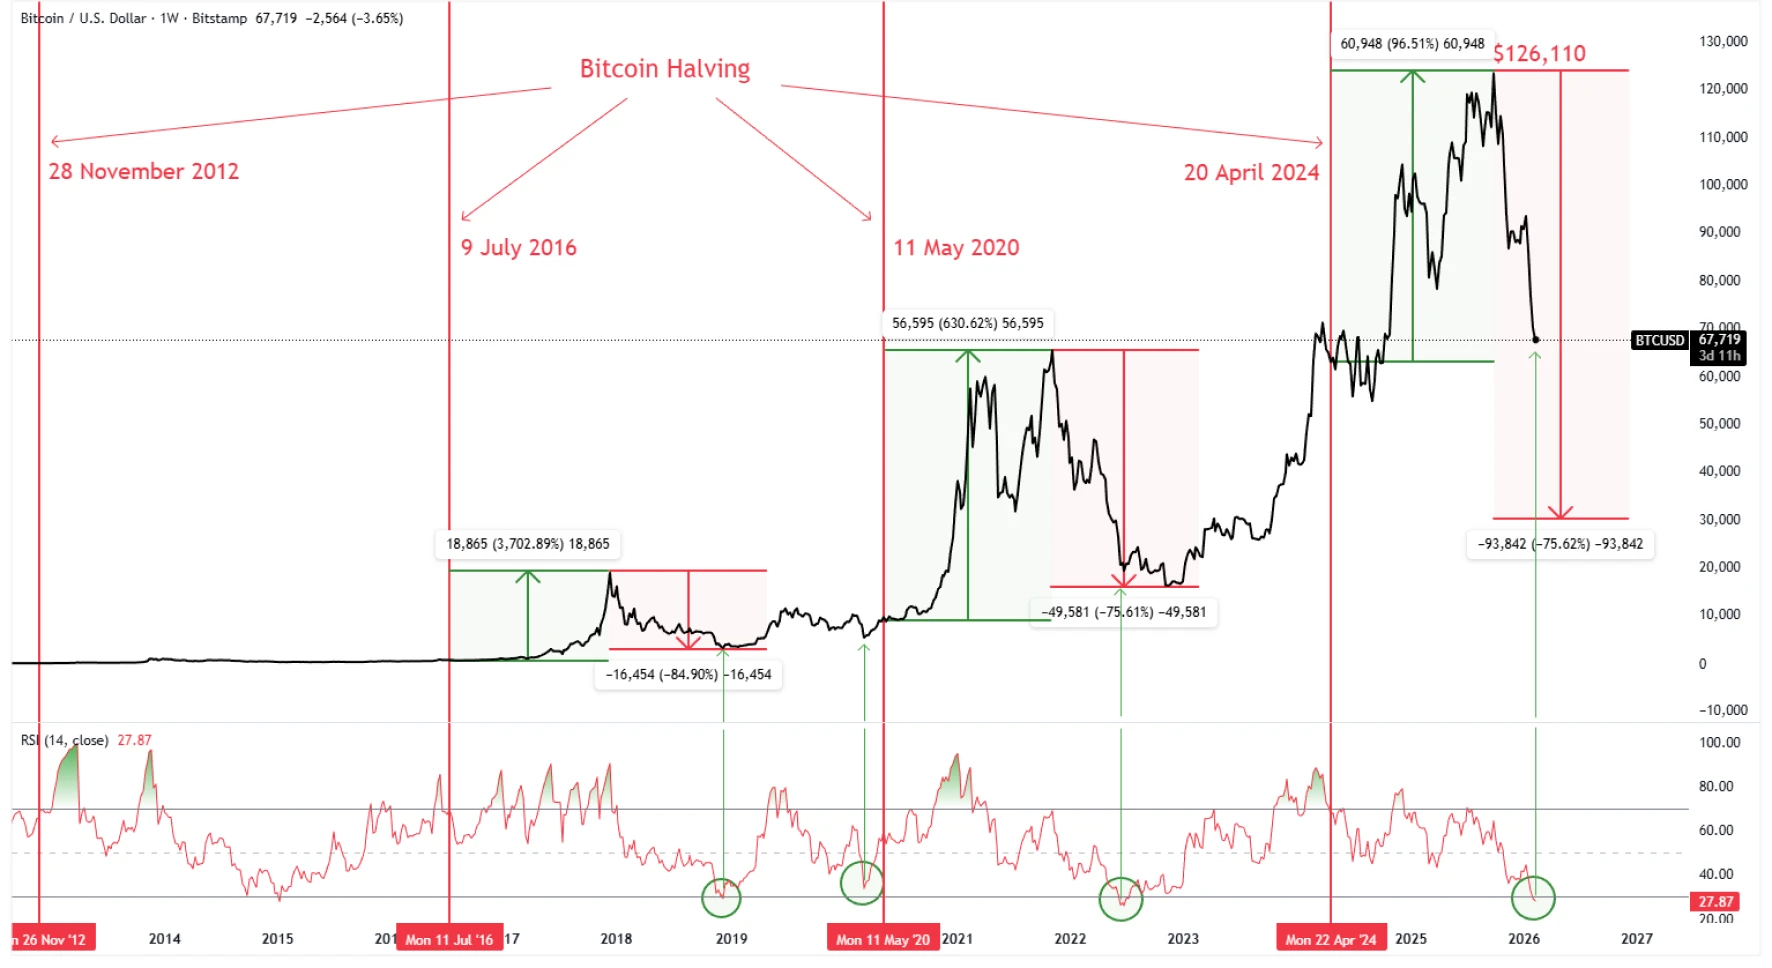
Source: TradingView. Weekly Bitcoin price chart, as of 12 February, 2026
Digital Gold or Growth Proxy?
Bitcoin’s identity remains central to its 2026 outlook.
If it is digital gold, it should perform best during periods of monetary debasement, inflation shocks, or systemic stress. If it is primarily a growth asset, it will remain correlated with Nasdaq beta and broader risk sentiment.
Recent price behaviour suggests a divergence from both interpretations, as Nasdaq and gold trade near record highs. However, Bitcoin’s volatility relative to gold has fallen to record lows, and on a volatility-adjusted basis, it increasingly compares favourably. While it may not yet function as a crisis hedge, its structural scarcity, capped supply, and improving volatility profile keep the digital gold thesis credible over a multi-year horizon.
The transition from speculative growth asset to mature monetary alternative is not instantaneous. It is gradual, and 2026 may prove to be a transitional year in that evolution.
ETFs and Institutionalization Provide Structural Support
The ETF ecosystem has matured significantly, though not without friction. In Q4 2025, Bitcoin ETFs experienced outflows of roughly $0.9 billion out of $56 billion in total assets. However, more recent sessions have recorded renewed net inflows, suggesting that institutional appetite has cooled, but not collapsed.
More importantly, institutional adoption extends well beyond ETFs. Central banks, sovereign wealth funds, and major endowments have continued to increase their exposure to digital assets. Unlike previous cycles dominated by retail speculation, the current environment increasingly features strategic accumulation on weakness rather than panic-driven liquidation.
Short-term volatility, therefore, does not invalidate Bitcoin’s longer-term monetary trajectory. The institutionalization theme remains intact and arguably represents the most important structural change compared to prior cycles.
Conclusion: A Major Bottom in the Making
Bitcoin enters 2026 in a different position from previous downturns. While price action remains volatile and sentiment fragile, the structural foundations of the asset are stronger than at any point in its history.
The $60,000 level is more than just technical support; it represents the halving anchor of this cycle. The evidence increasingly suggests that Bitcoin is either forming or is very close to forming a major cyclical low.
Even in a conservative scenario, downside risk appears more contained than in past cycles, supported by institutional capital, ETF infrastructure, and global liquidity.
Bitcoin may not deliver an explosive vertical rally in the immediate term. But 2026 increasingly resembles a transitional year, one that resets positioning, rebuilds conviction, and lays the groundwork for the next major structural advance.
The long-term trend remains upward. Scarcity is intact. Adoption continues. Institutional ownership is deepening. And if history rhymes, even if it does not repeat exactly, the next few years are likely to produce a fresh record high well above $180,000.
In that sense, $60,000 may not be the ultimate bottom, but it may well be remembered as the foundation of the next bull cycle.