Ethereum (ETH) has been kind to short sellers all year. But with ETH now up nearly 20% from its 6 June low, that may be changing. Ethereum's price chart gives us three potential reasons for having a long bias on ETH.
Reason 1: ETH is trading near 3-year support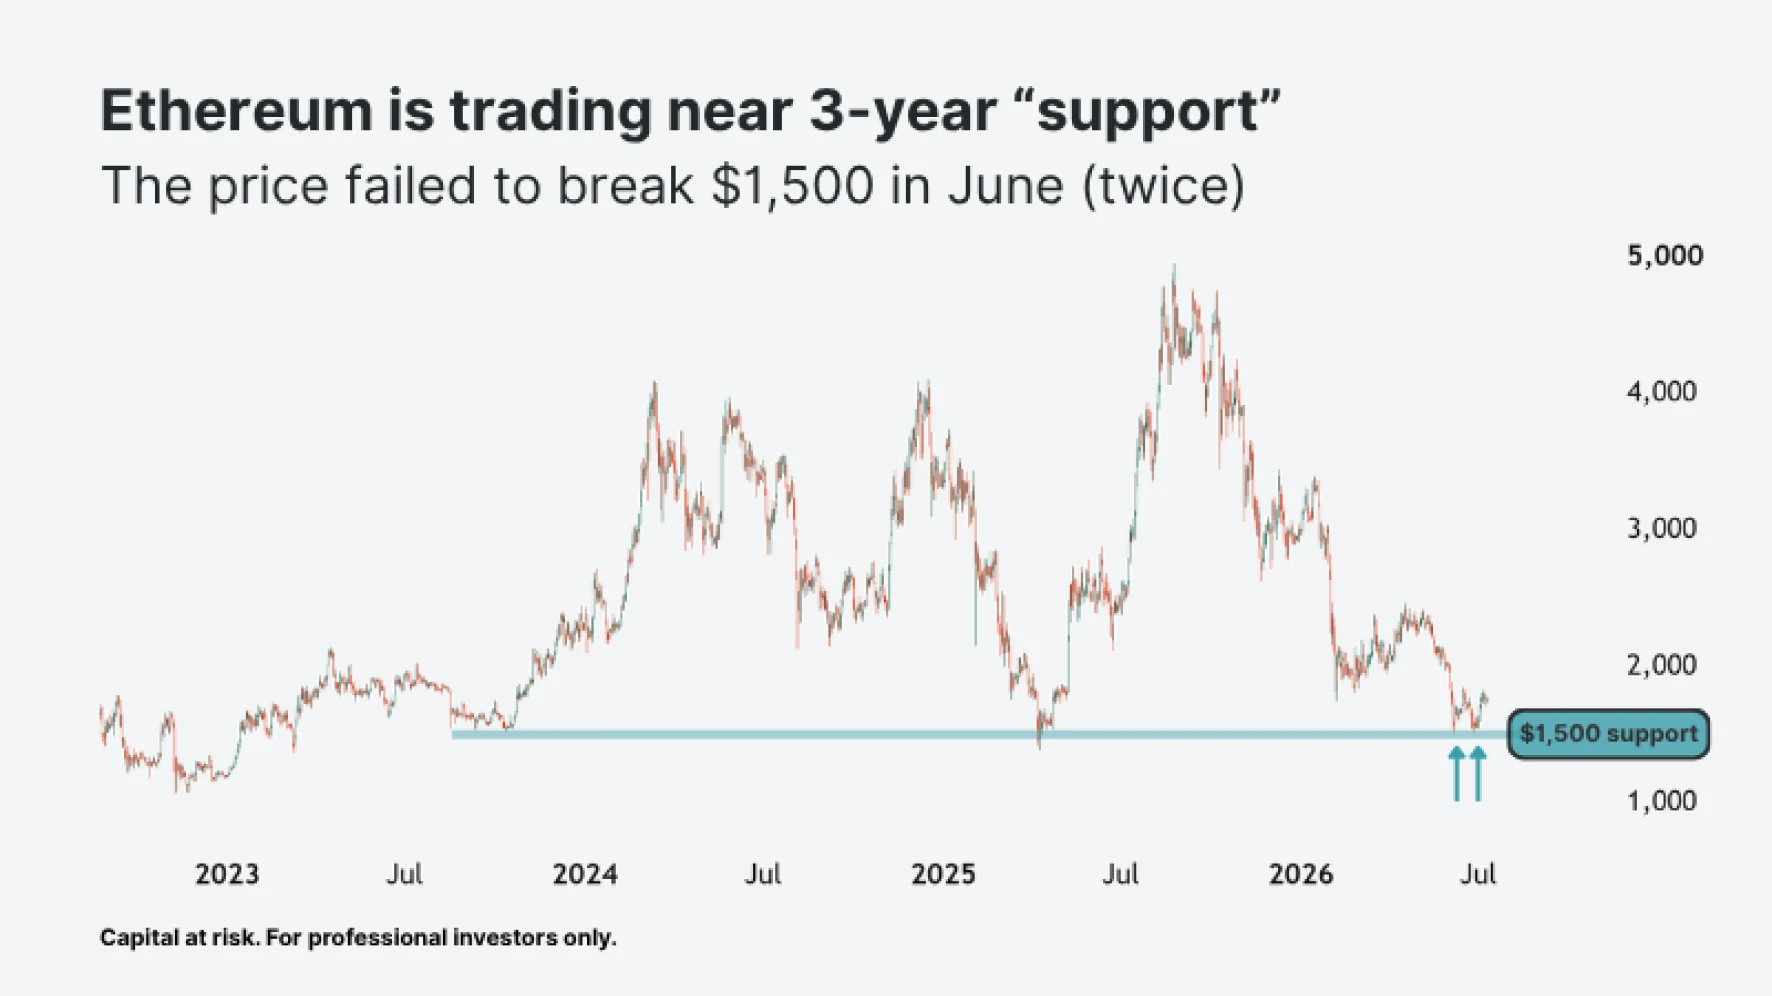
Data sourced from TradingView on 10 July 2026. ETHUSD daily candles.
Support is a price area where buyers have stepped in before. For Ethereum, that area is around $1,500 – a level the price has held for three years.
The price tested that support twice in June – and failed to break it. Note the double bottom pattern in the chart, where two failed attempts at new lows could signal that sellers are running out of fuel.
Reason 2: ETH could be forming a higher low on the daily chart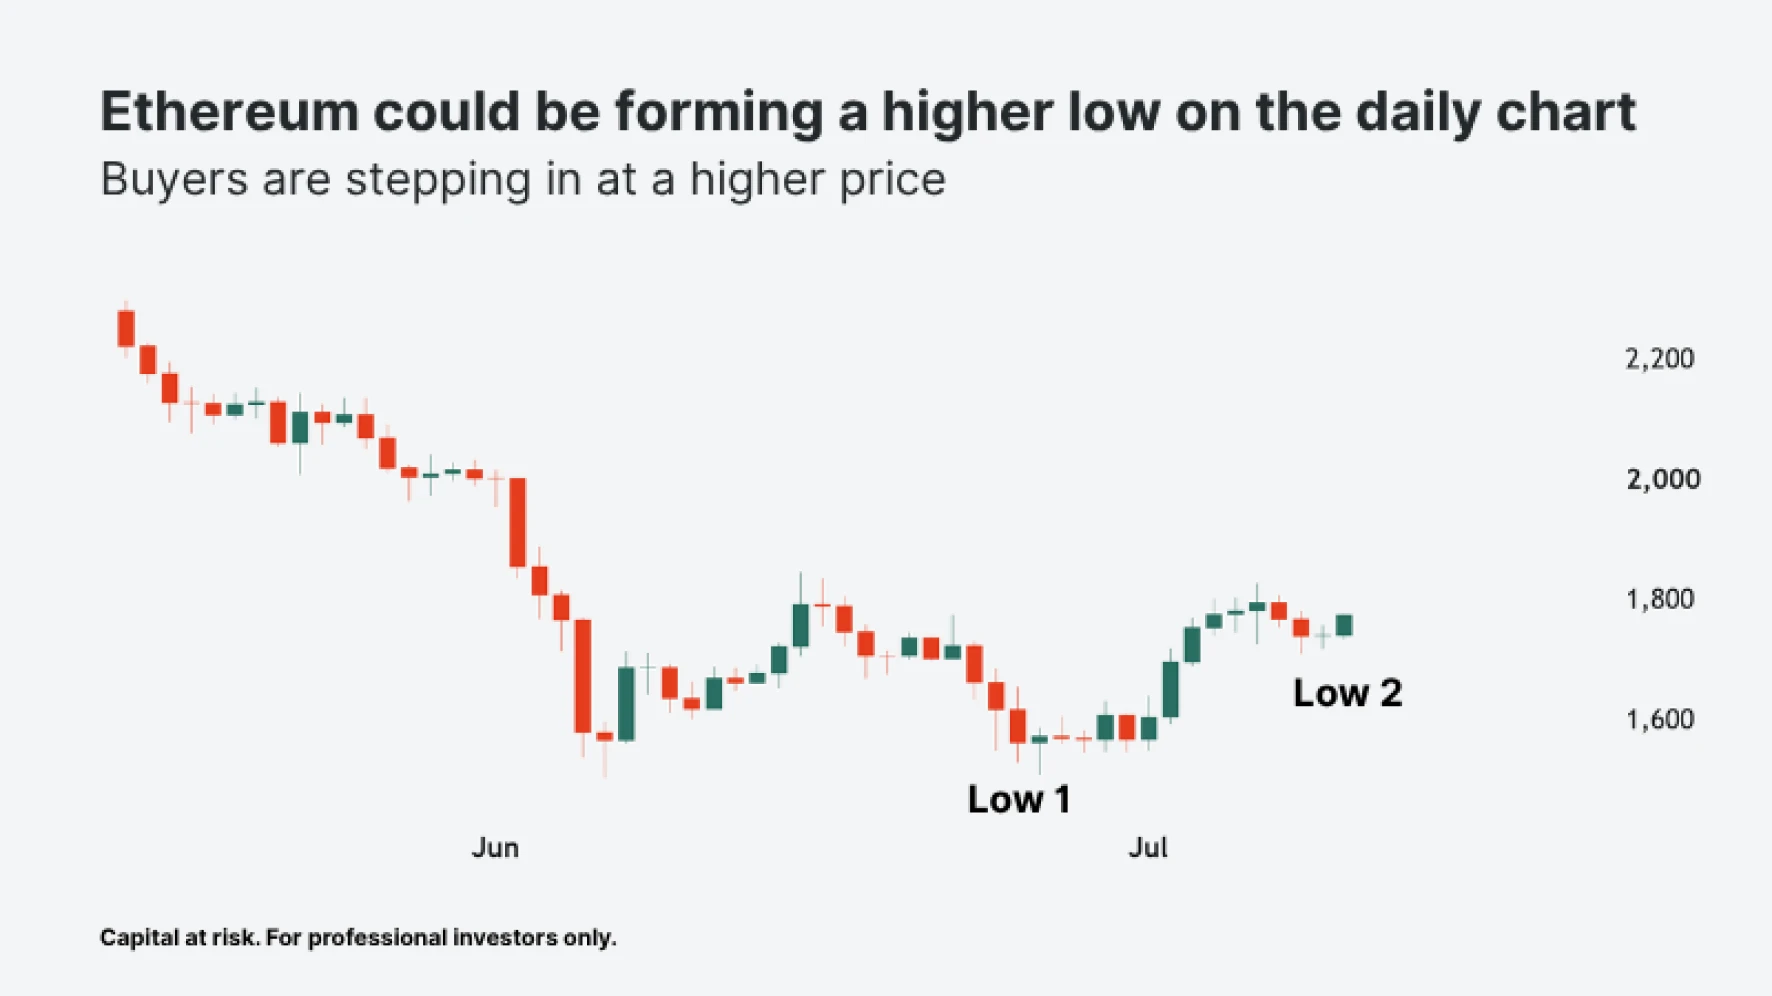
Data sourced from TradingView on 10 July 2026. ETHUSD daily candles.
A higher low forms when the price pulls back but stops falling above its previous low. It suggests buyers are stepping in at higher prices, rather than waiting for cheaper ones.
Ethereum's July low (Low 2) has so far held above its June low (Low 1). That doesn't confirm a new uptrend on its own. But it's often one of the first signs of one.
Reason 3: ETH is above its 20-day moving average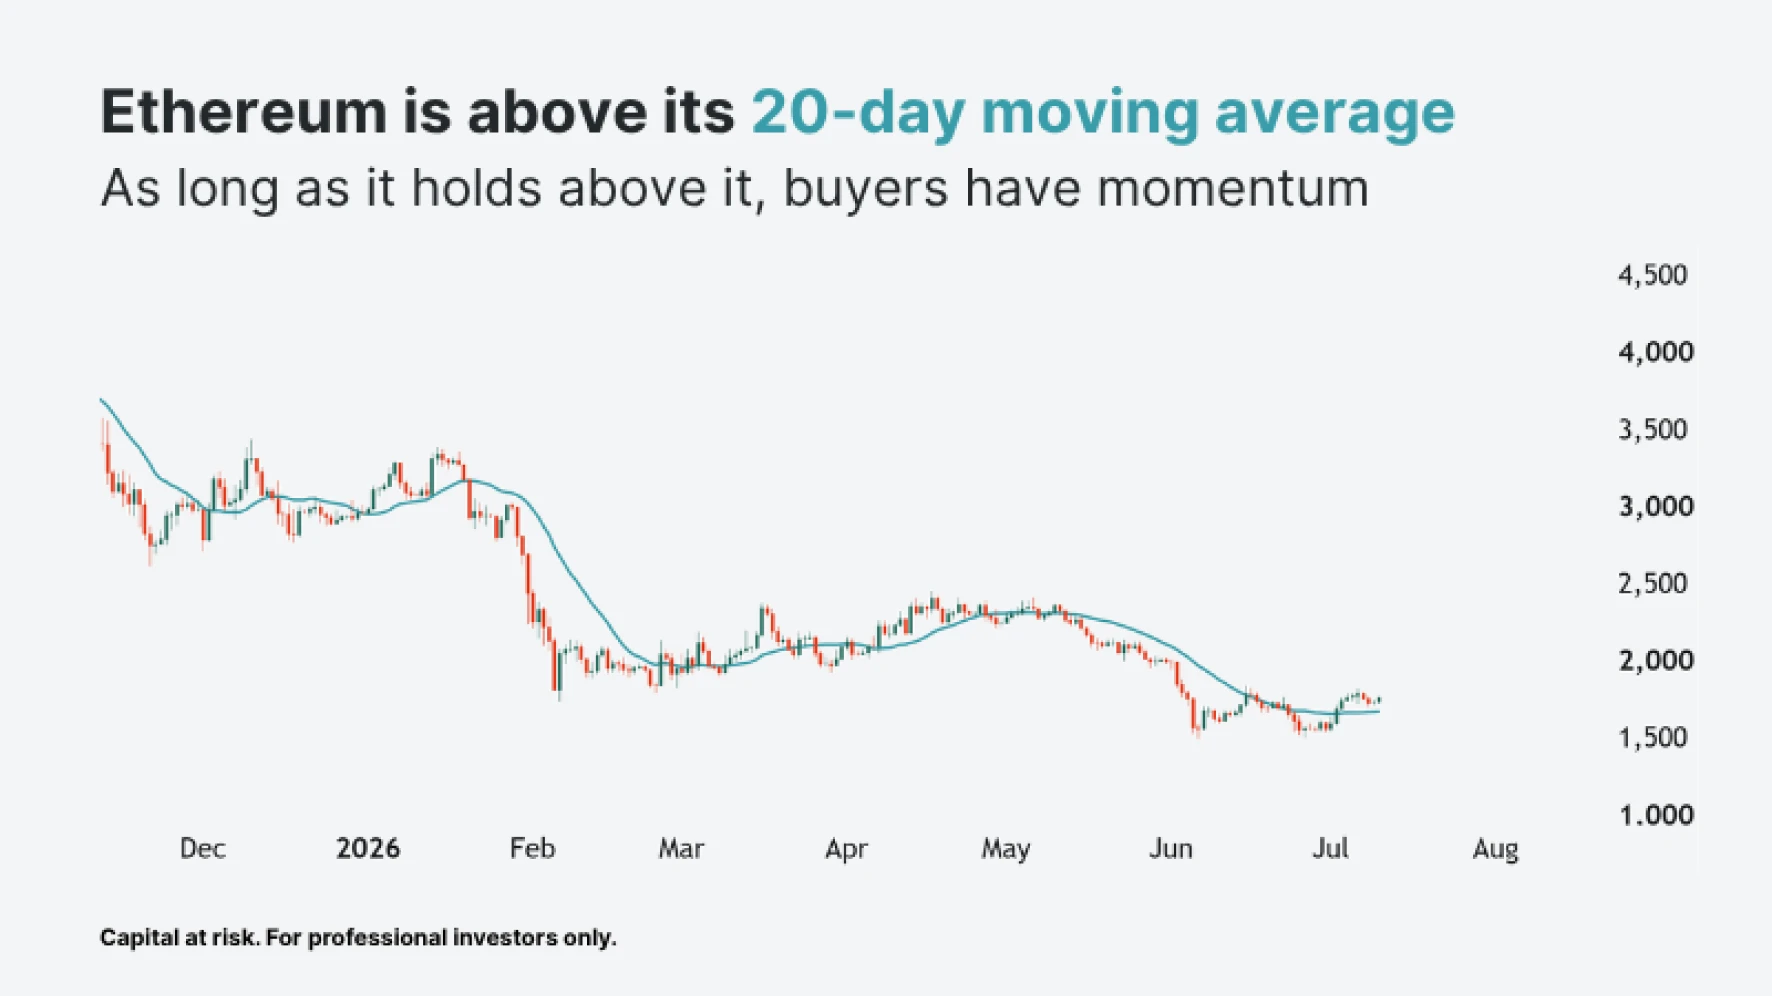
Data sourced from TradingView on 10 July 2026. ETHUSD daily candles.
The 20-day moving average tracks the average price over the past 20 trading days. When the price trades above it, short-term momentum tends to favour buyers.
ETH reclaimed its 20-day moving average in early July and has held above it since. As long as that continues, the long bias has momentum behind it. A decisive drop back below the average would weaken the case.
Leverage Shares offers 3X long and short Ethereum ETPs. Capital at risk.
Key takeaways
- Ethereum has held its 3-year support around $1,500, with a double bottom forming in June.
- A higher low on the daily chart and the price reclaiming its 20-day moving average both point to improving momentum.
- These signals support a long bias but don't guarantee one. A decisive break below the 20-day moving average, or below $1,500, would change the picture.
Your capital is at risk if you invest. You could lose all your investment. Past performance is not a reliable indicator of future results.