Bitcoin hit a low around $60,000 in early February 2026. Three months later, and there's still no “bull market”. The price has bounced around 30% off that low, but it’s now stalling again. For anyone waiting on the potential next leg up, it's dull. But this kind of slow grind is how bitcoin has tended to bottom before.
How long past bitcoin bottoms took to recover
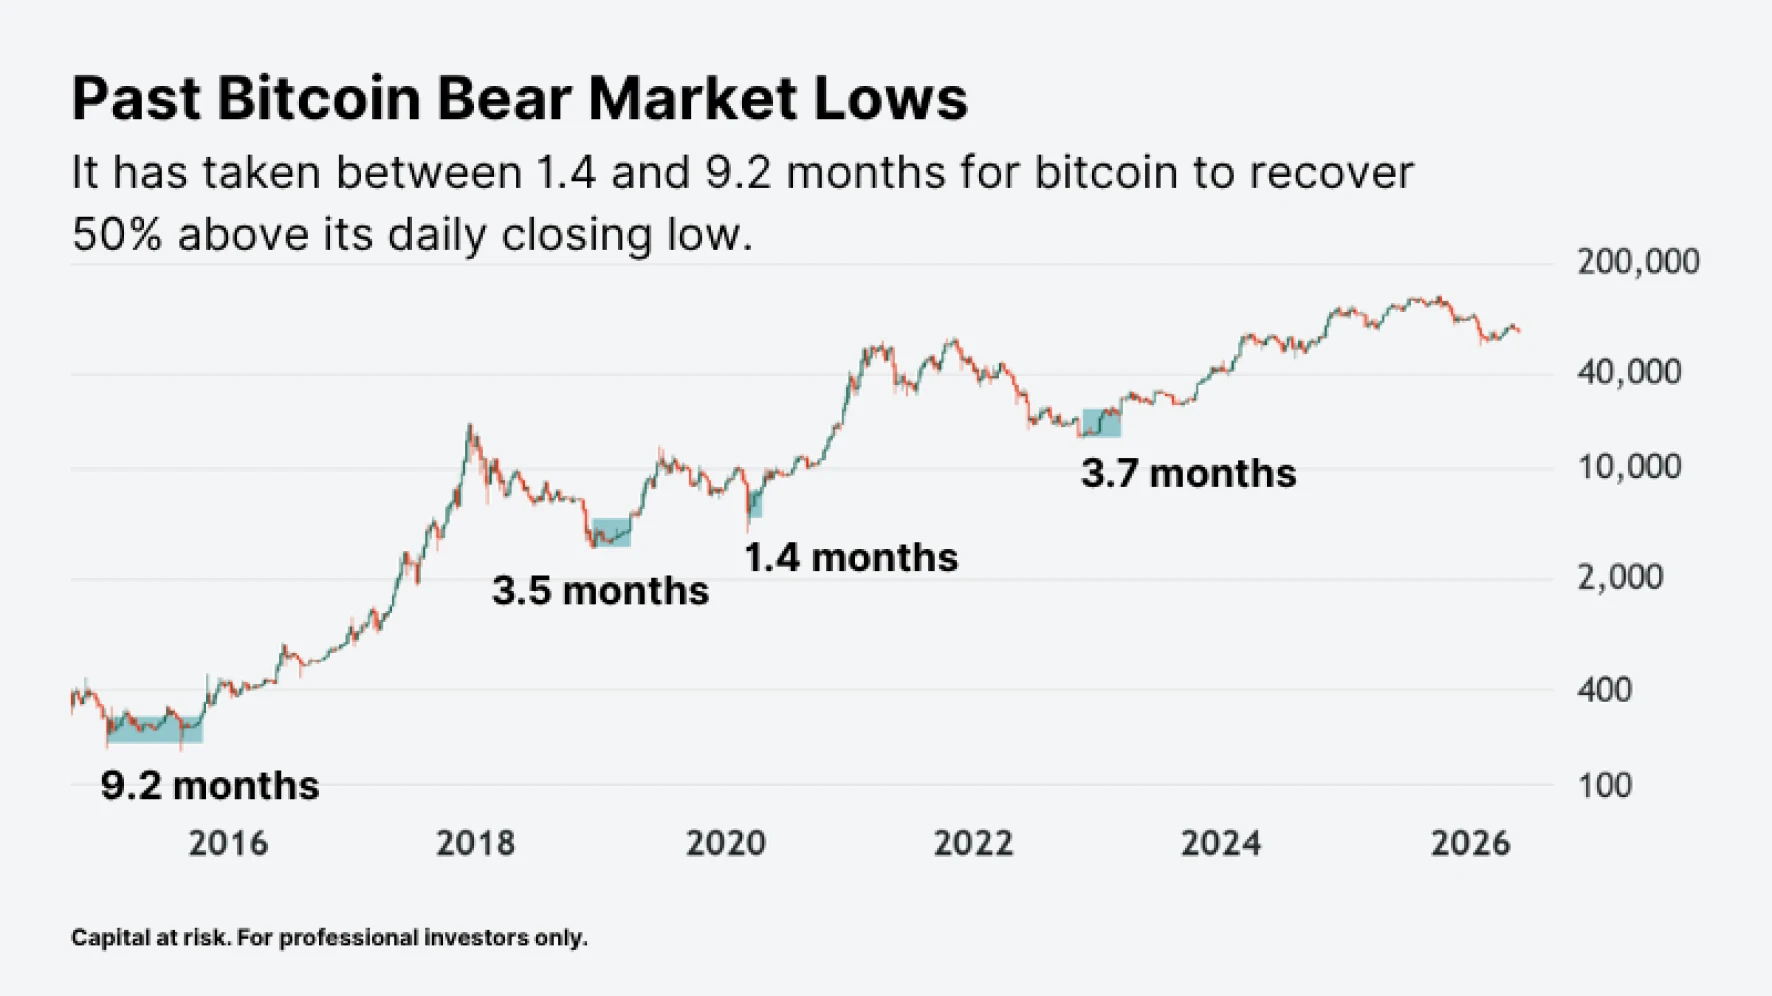
We measured each recovery the same way. First we found bitcoin's lowest daily closing price, then drew a line 50% above it. We then counted the days until the price closed above that line for good.
Here's what the last four drops looked like.
Source: TradingView (BTCUSD, Bitcoin all time history index). Past performance is not a reliable indicator of future results.
Source: TradingView (BTCUSD, Bitcoin all time history index). Past performance is not a reliable indicator of future results.
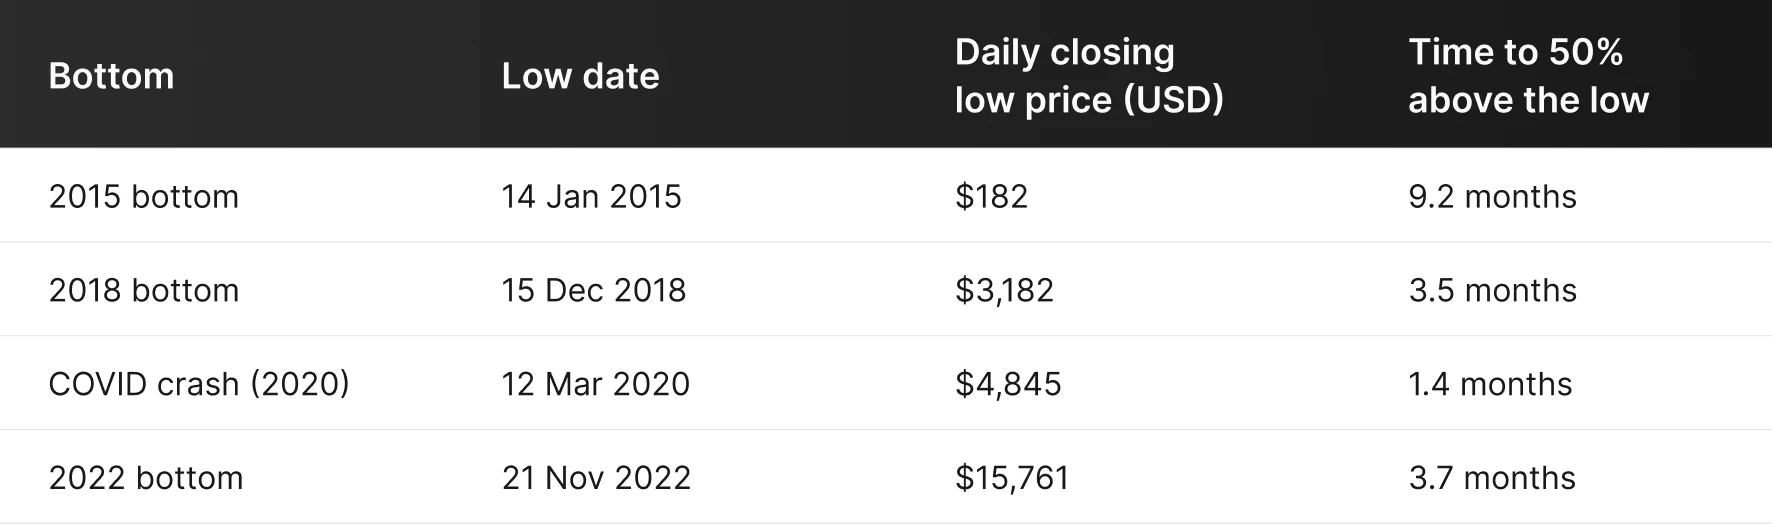
Three of the four bottoms took months, not weeks. The 2018 and 2022 lows each took around three and a half months to break through the 50% level. After the 2015 low, bitcoin dragged on for over nine months. The COVID crash was the odd one out at six weeks. But you could argue this was a “Black Swan” anomaly – not a normal cycle low.
What is bitcoin doing now?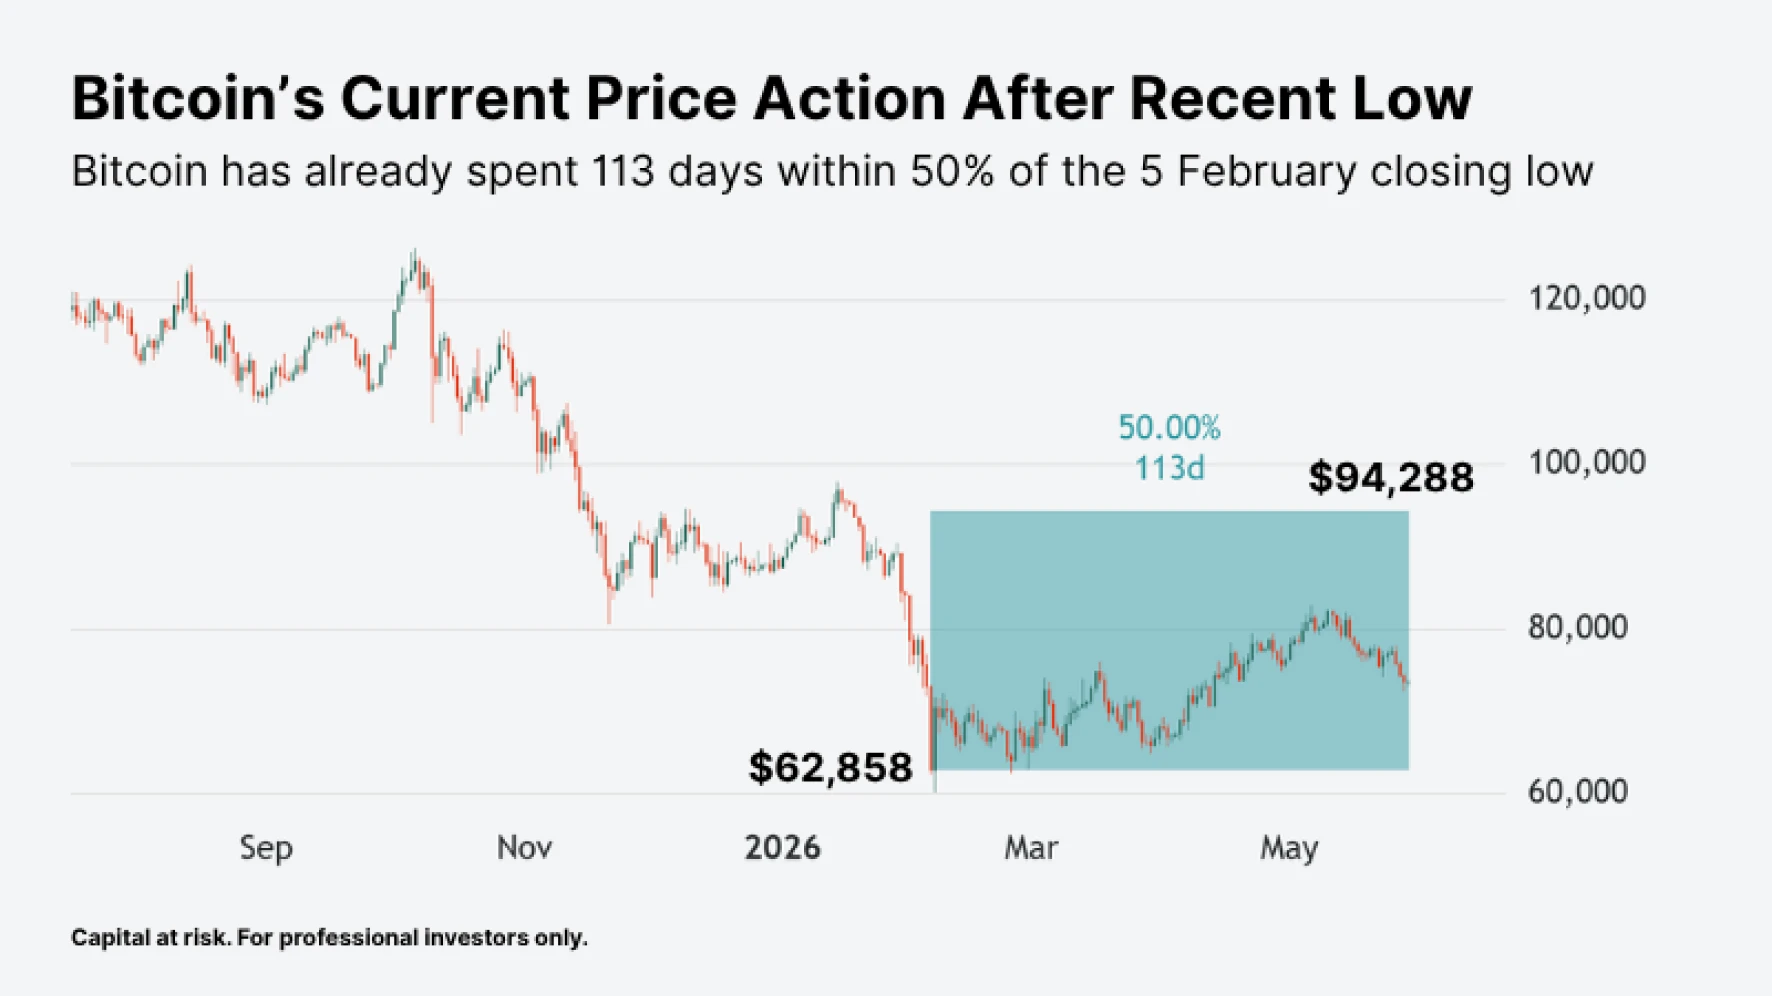
Source: TradingView (BTCUSD, Bitcoin all time history index). Data as of 29 May, 2026.
Bitcoin's lowest daily close was $62,858 on 5 February 2026, with an intraday wick down to $60,133 the next day. Since then it's bounced and stalled above that low for about 3.7 months (113 days).
To recover under our 50% rule, bitcoin needs to close above $94,288 – and never look back. It's still well below that price. In 2018 and 2022, bitcoin had already cleared the 50% recovery level by now. So if 5 February was "the bottom", this grind is already slower than those two.
But if history is anything to go on, a grind like this isn't unusual. In past cycles, it’s taken time for investors to accumulate positions at lower prices.
What a sideways range means for leveraged crypto products
Leverage Shares 3X Bitcoin exchange-traded products aim to magnify bitcoin's daily move by three times, before fees. They come in long and short versions, and both reset their leverage exposure at the end of each trading day.
In a sideways market, that brings potential pros and cons. On one hand, the products reset to 3X every day. In a choppy market, that reset compounds across up and down days. Over time, it can pull a held position below three times bitcoin's actual move. On the other hand, the price still moves each day, in both directions. So a trader can still take a long or short position to suit their short-term view.
Leverage Shares offers 3x long and 3x short Bitcoin ETPs for traders who want amplified daily exposure to bitcoin’s price moves. Capital at risk.
Key takeaways
Bitcoin's lowest daily close was $62,858 on 5 February 2026. Three months on, it's still trading in a range above that low.
In past cycles, bitcoin bottoms took months to clear. The 2018 and 2022 lows both took around three and a half months to break 50% above the low.
Leveraged crypto ETPs reset daily, so they may suit short-term positions. In a sideways market, the daily reset can cause volatility decay over time.