Bitcoin has never closed a monthly candle below the lower Bollinger Band. In this year's selloff, the price bounced before reaching that band again. The monthly bands are also squeezing, meaning volatility is compressing on the higher time frames. Here's what it could mean for investors.
What Bollinger Bands measure
Bollinger Bands track an asset's volatility around its 20-period moving average. On the monthly chart, that's the 20-month moving average. The upper and lower bands represent two standard deviations of price movement away from that average (aka volatility). So when bitcoin's volatility rises, the bands widen. When volatility falls, the bands contract.
The chart below shows bitcoin’s monthly candles since it began trading. Bollinger Bands appear from 2011, once 20 months of price data were available. We've plotted this on a log scale to make the historical moves more visible. The price has come close to the lower Bollinger Band before, but never closed a month below it. So far, that pattern is still intact. The fact that volatility has gradually dropped during the selloff (narrowing bands) could suggest long-term buyer accumulation.
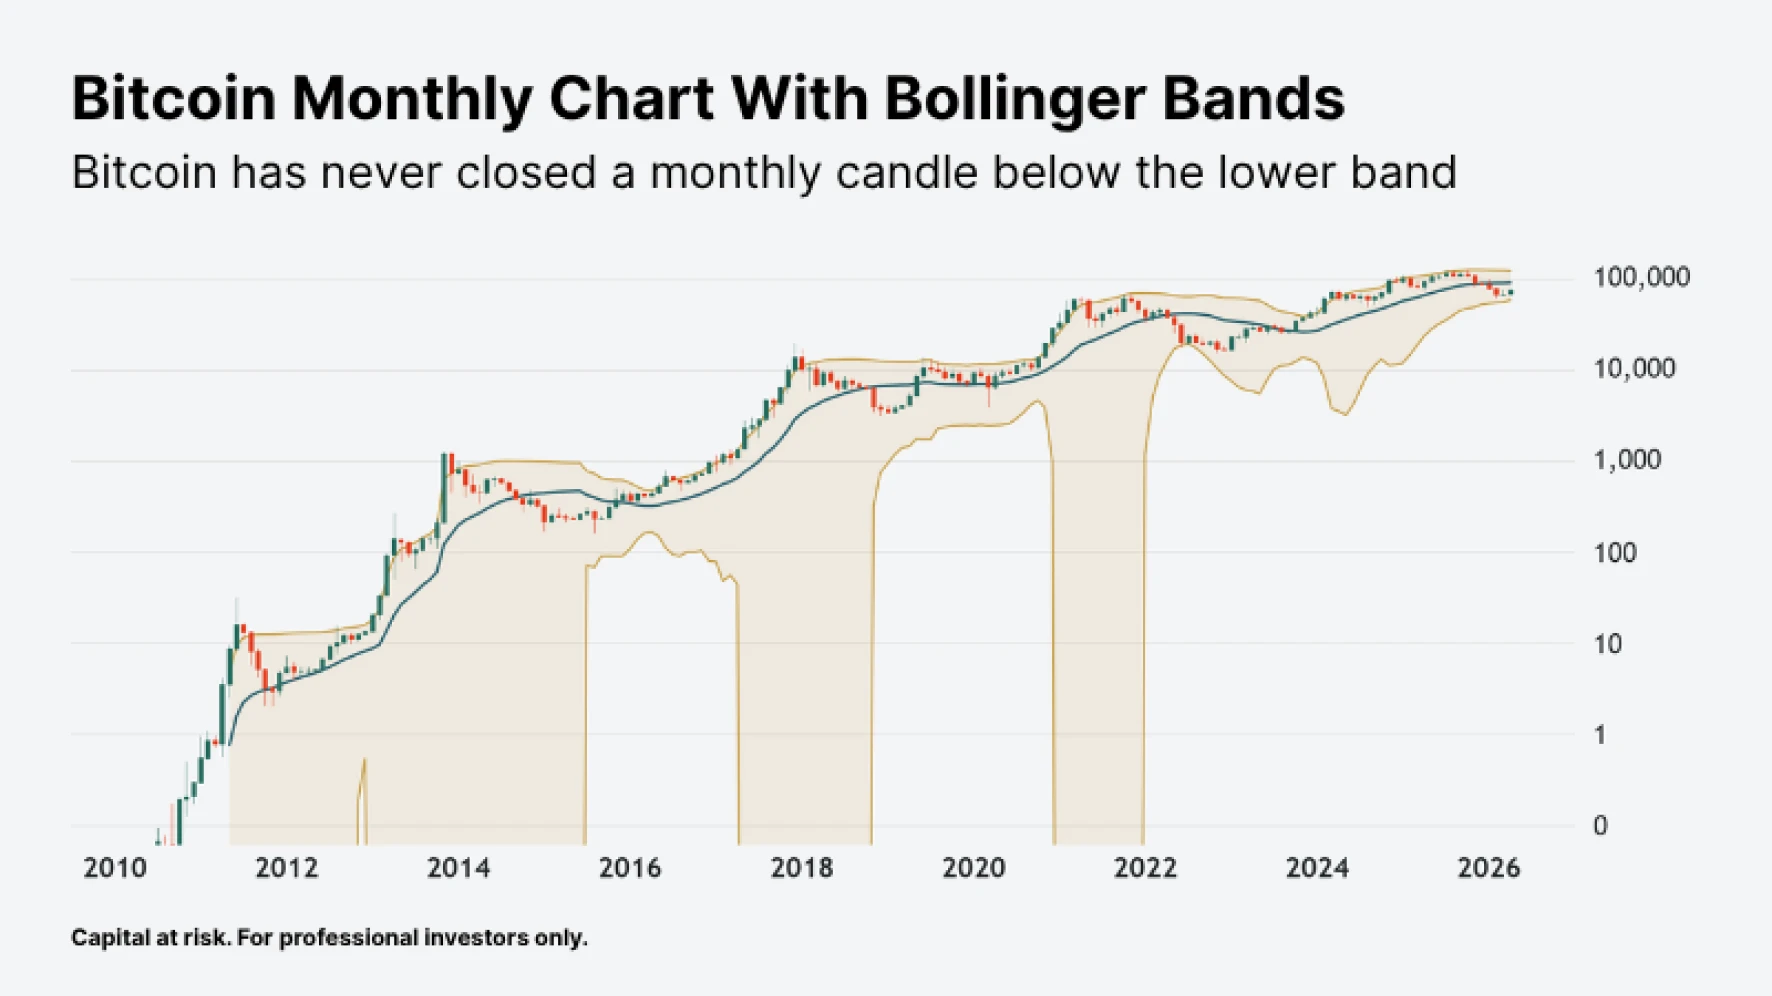
Source: TradingView | As of 30 April 2026
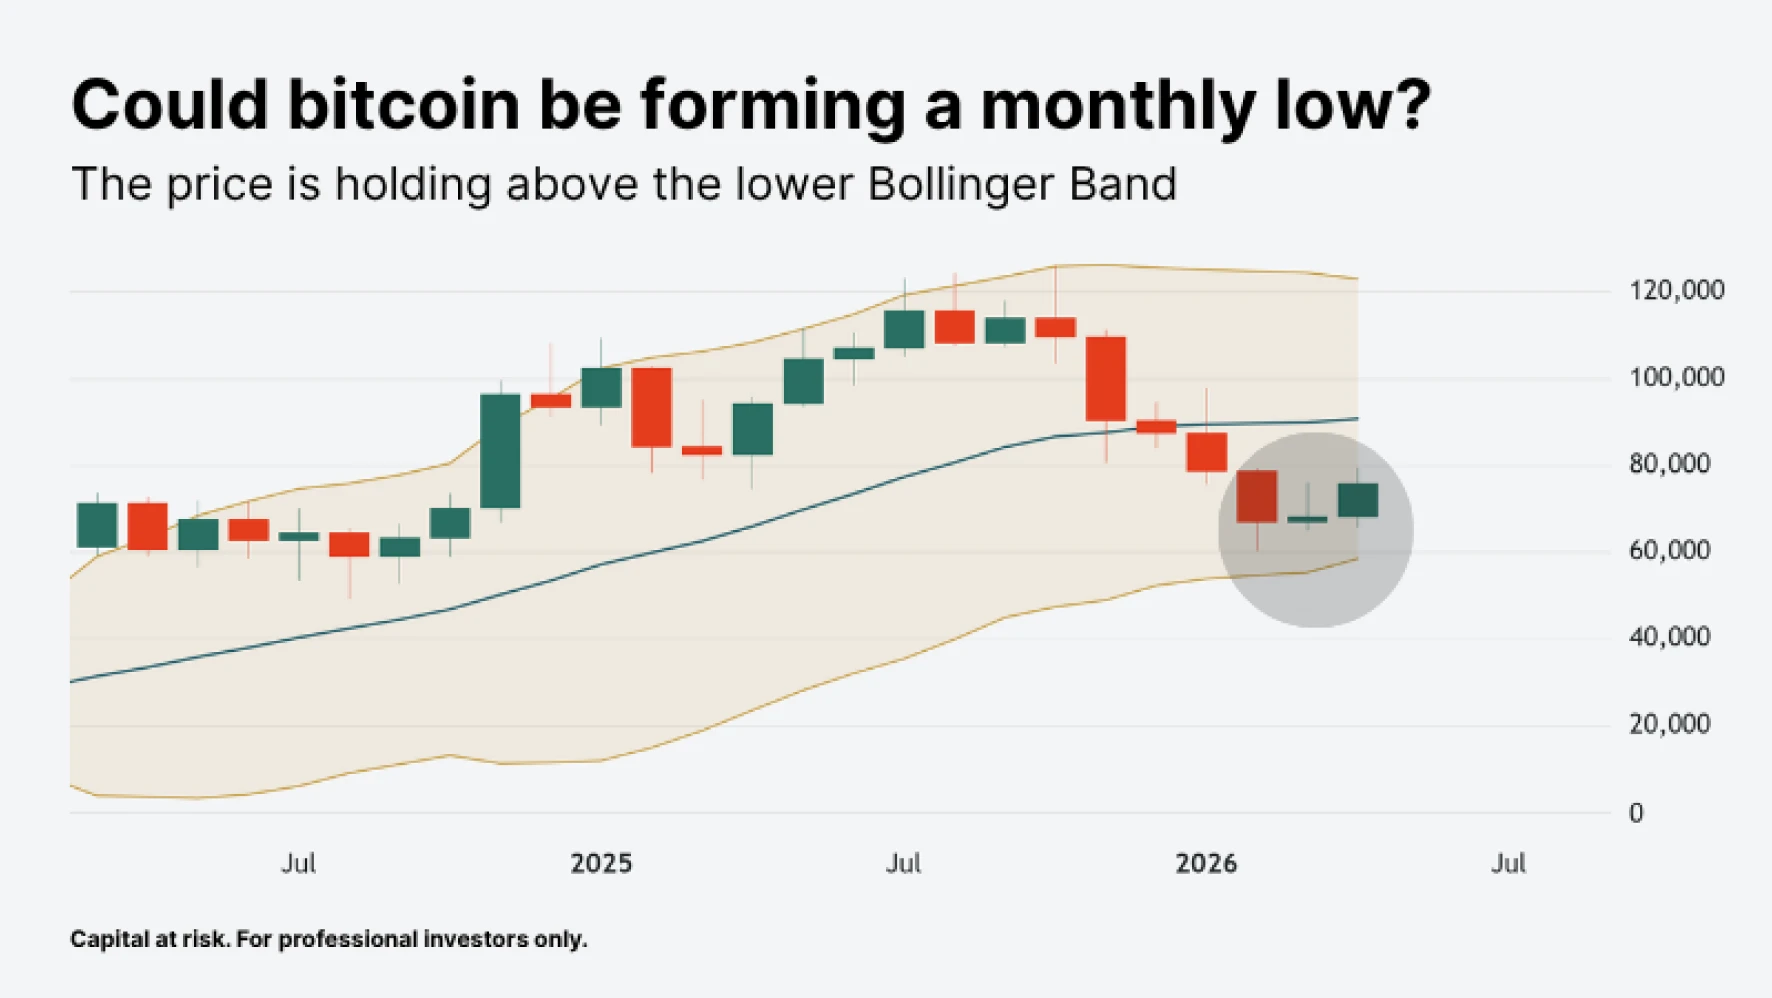
Zooming in: bitcoin monthly candle analysis
Bitcoin tagged the upper Bollinger Band at the October top last year (around $126,000). October finished as a red candle, followed by four more red months from November through February. Meanwhile, bitcoin sank to the bottom band.
March was the first green month in five – but only just. The price moved around intramonth, but finished March only slightly higher than it started. That showed indecision among buyers and sellers.
With one day left in April, bitcoin has a chance to finish with a stronger green month. Technically speaking, that could suggest a higher time frame “low” – above the lower Bollinger band.
Source: TradingView | As of 30 April 2026
Leverage Shares offers 3x long and 3x short Bitcoin ETPs for traders who want amplified daily exposure to bitcoin price moves. Capital at risk.
Key takeaways
Bitcoin has never closed a monthly candle below the lower Bollinger Band. The band has acted as a historic monthly floor.
Volatility on the monthly chart has compressed during the selloff, suggesting long-term buyer accumulation.
A green April candle would suggest a higher time frame low has formed, above the lower band.