Bitcoin has mostly moved in the same direction as the Global Liquidity Index over the past decade. But since October last year, liquidity has kept rising while bitcoin has fallen. Does this recent divergence change the long-term relationship, or is it just a normal part of the crypto cycle?
Bitcoin’s relationship with the Global Liquidity Index
The Global Liquidity Index aggregates major central bank balance sheet and money supply data into a single measure of global monetary expansion. It also incorporates other liquidity measures like the Treasury General Account (TGA) and Reverse Repurchase Agreements (RRP).
When the index rises, there’s generally more liquidity flowing through the global financial system. Historically, bitcoin has tended to absorb liquidity – and rally – when the index rises. That’s mainly down to two reasons:
First, bitcoin is a scarce and global digital commodity. So when the global money supply expands, some investors have bought bitcoin as a potential hedge against international currency debasement.
Second, general investor risk appetite can increase with liquidity. Other investors see bitcoin as a “risk-on” asset, so they bought more bitcoin as liquidity expanded.
The chart below shows bitcoin’s historical relationship with the Global Liquidity Index. The bitcoin price has generally (but not perfectly) tracked the direction of global liquidity. But after bitcoin peaked in October, the two have moved in opposite directions. Liquidity has kept rising while bitcoin has halved in price.
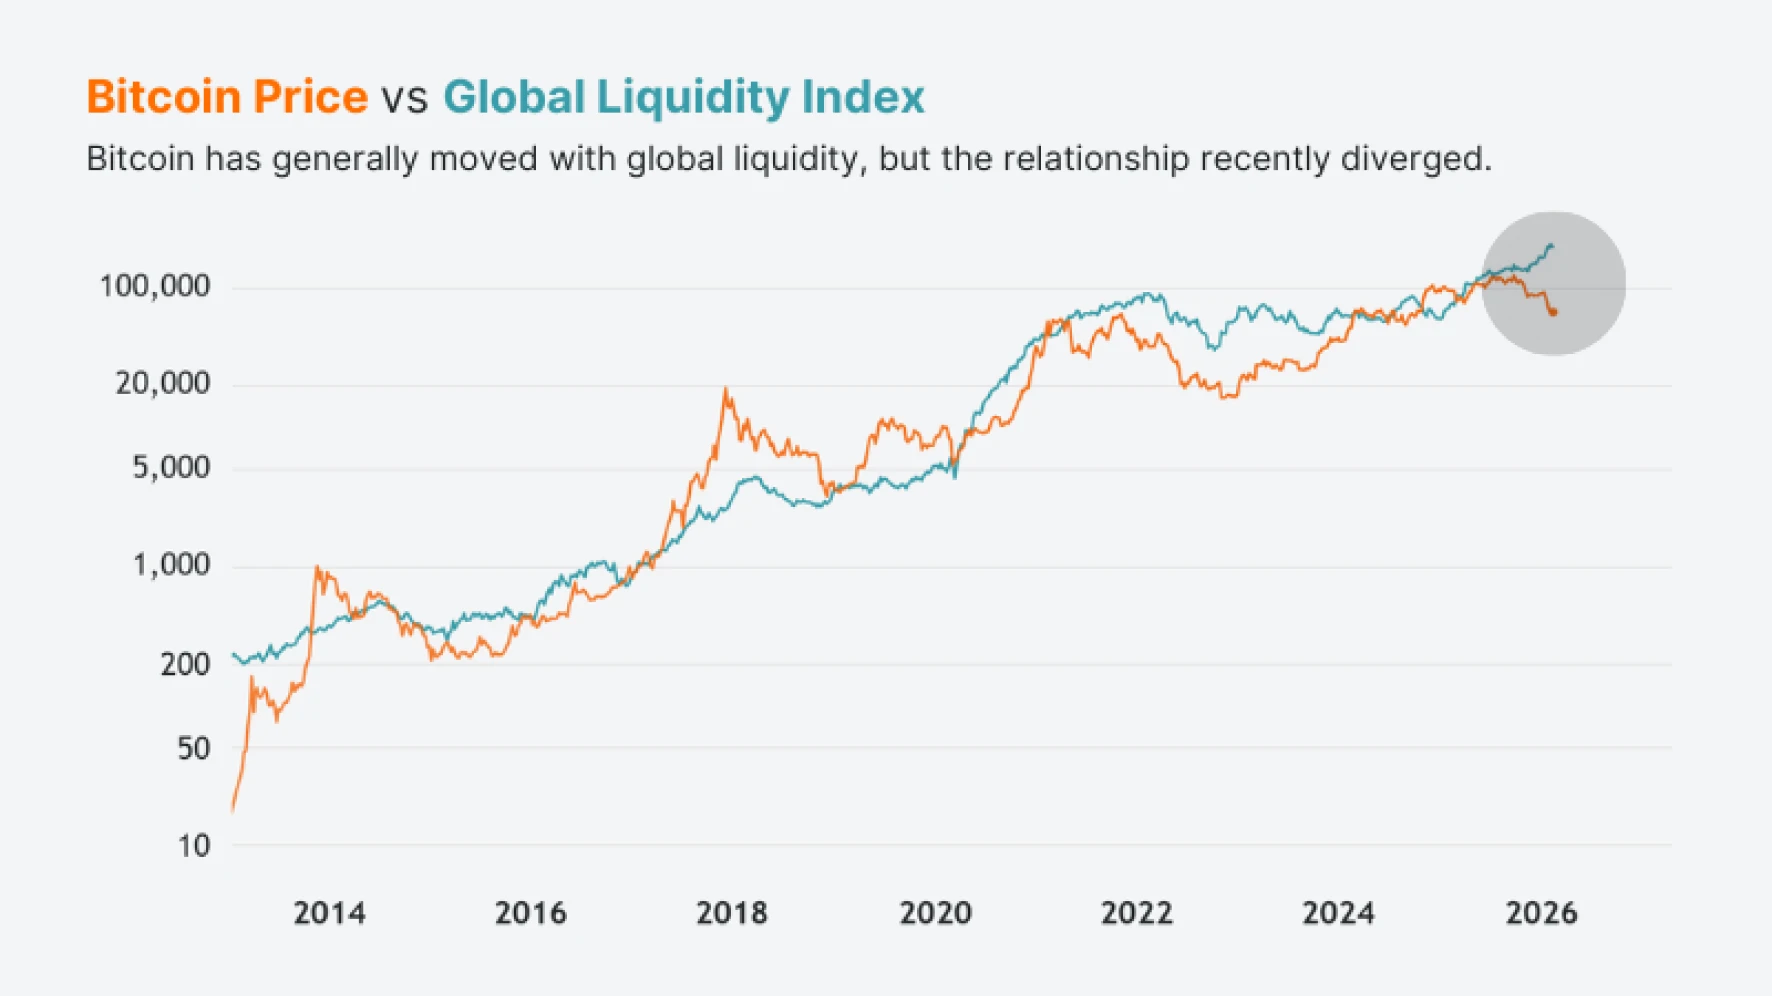
Source: TradingView | As of 20 February 2026
How correlated are bitcoin and the Global Liquidity Index?
It’s one thing to say bitcoin “moves with liquidity”, but it’s another thing to measure it. To quantify the relationship, we can use the 52-week rolling correlations between bitcoin and the Global Liquidity Index.
But first, we need to apply the natural logarithm to both bitcoin’s price and the index level. That’s because bitcoin trades in much bigger numbers than the Global Liquidity Index. Logging both series makes them more comparable. Next, we can measure the rolling 52-week correlations of the two log values. That tracks how closely they move together over time.
The chart below shows how those correlations have changed over the past 10 years (teal line). A reading closer to 1 means they moved more in sync over the most recent 52 weeks (higher correlation). A reading near 0 suggests a weak relationship (low correlation). And a negative reading means they moved in opposite directions (negative correlation). The orange line is the bitcoin price.
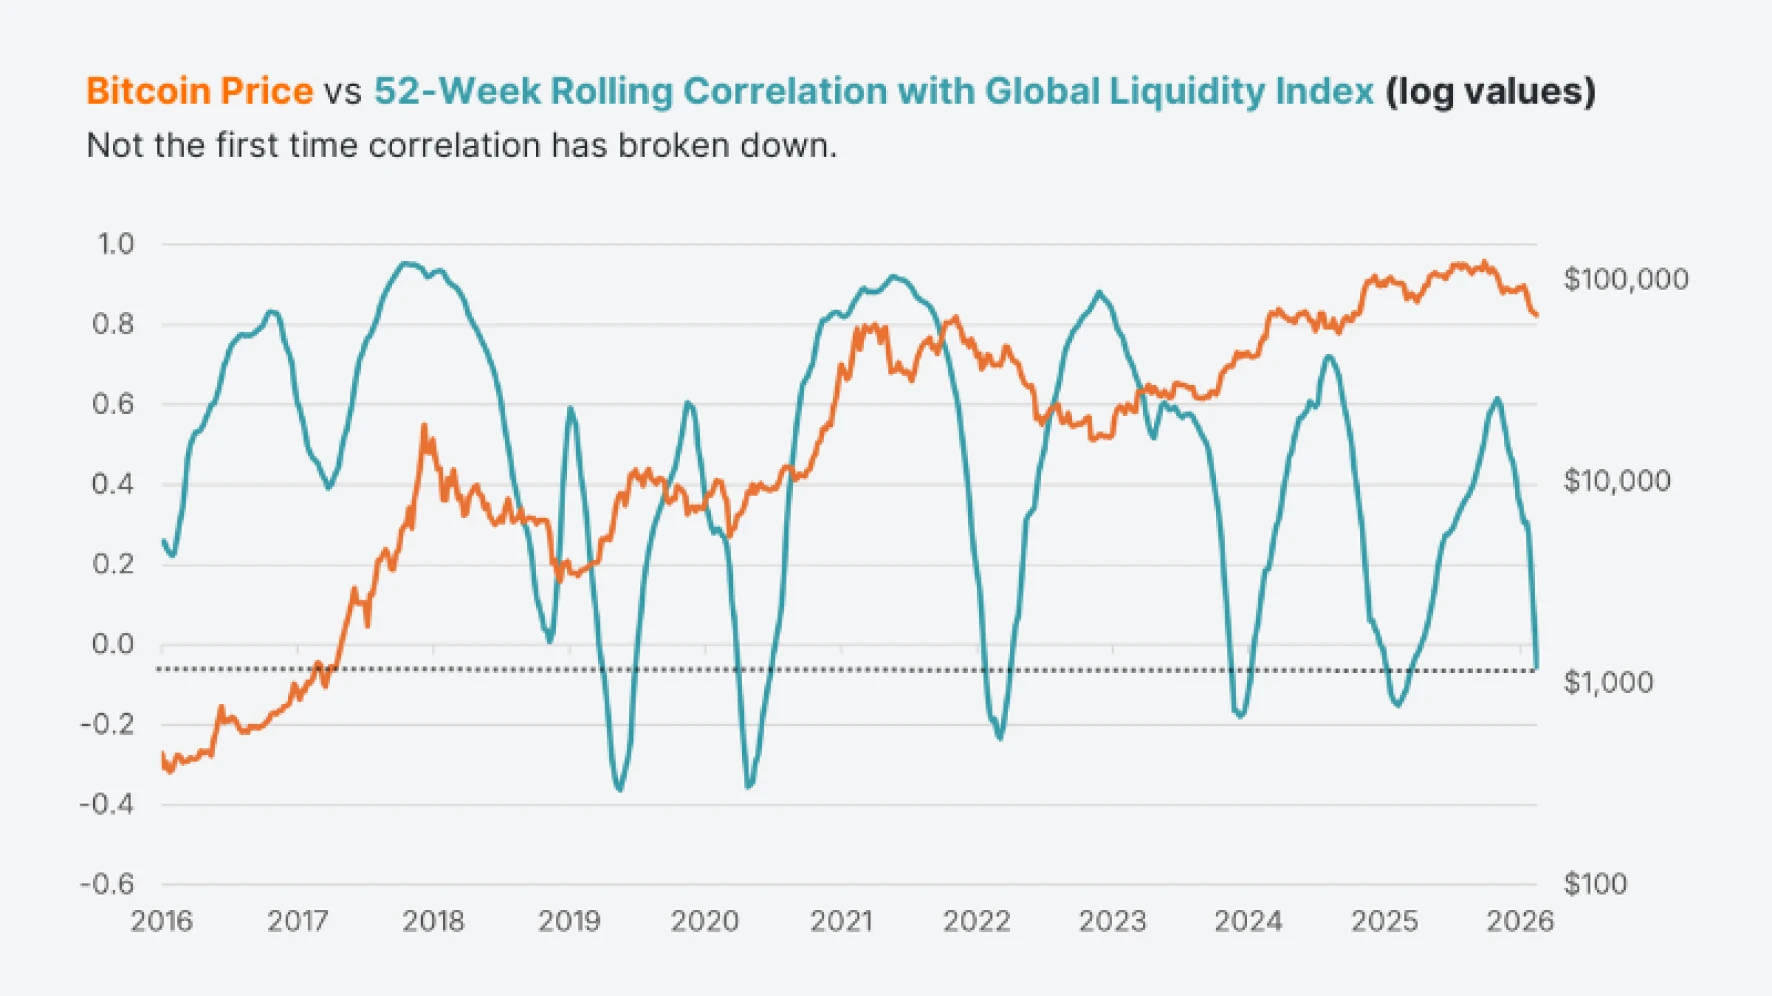
Source: TradingView | As of 20 February 2026
There have been extended periods where bitcoin and global liquidity moved closely together. The correlation rose toward 0.8–0.9 during major liquidity-driven bull markets. But it also broke down in 2019, 2020, 2022, 2024, 2025 – and again more recently.
The relationship exists, but it expands and contracts through time. On that basis, there’s nothing “unusual” about the current reading.
Leverage Shares offers 3X leveraged long and short bitcoin exchange-traded products.
Key takeaways
Bitcoin has historically moved in line with the Global Liquidity Index, especially during major liquidity expansions.
The 52-week rolling correlation shows that the relationship strengthens and weakens across cycles. It doesn’t stay constant.
The current divergence between bitcoin and the Global Liquidity Index isn’t unusual. It doesn’t automatically change the long-term liquidity thesis for bitcoin.
For a deeper understanding of bitcoin’s fundamentals, see our bitcoin guide.