Bitcoin has fallen considerably from its October 2025 peak of $126,000. There’s no way to predict the ultimate “low”, but three indicators suggest the $60,000 region may represent a value zone.
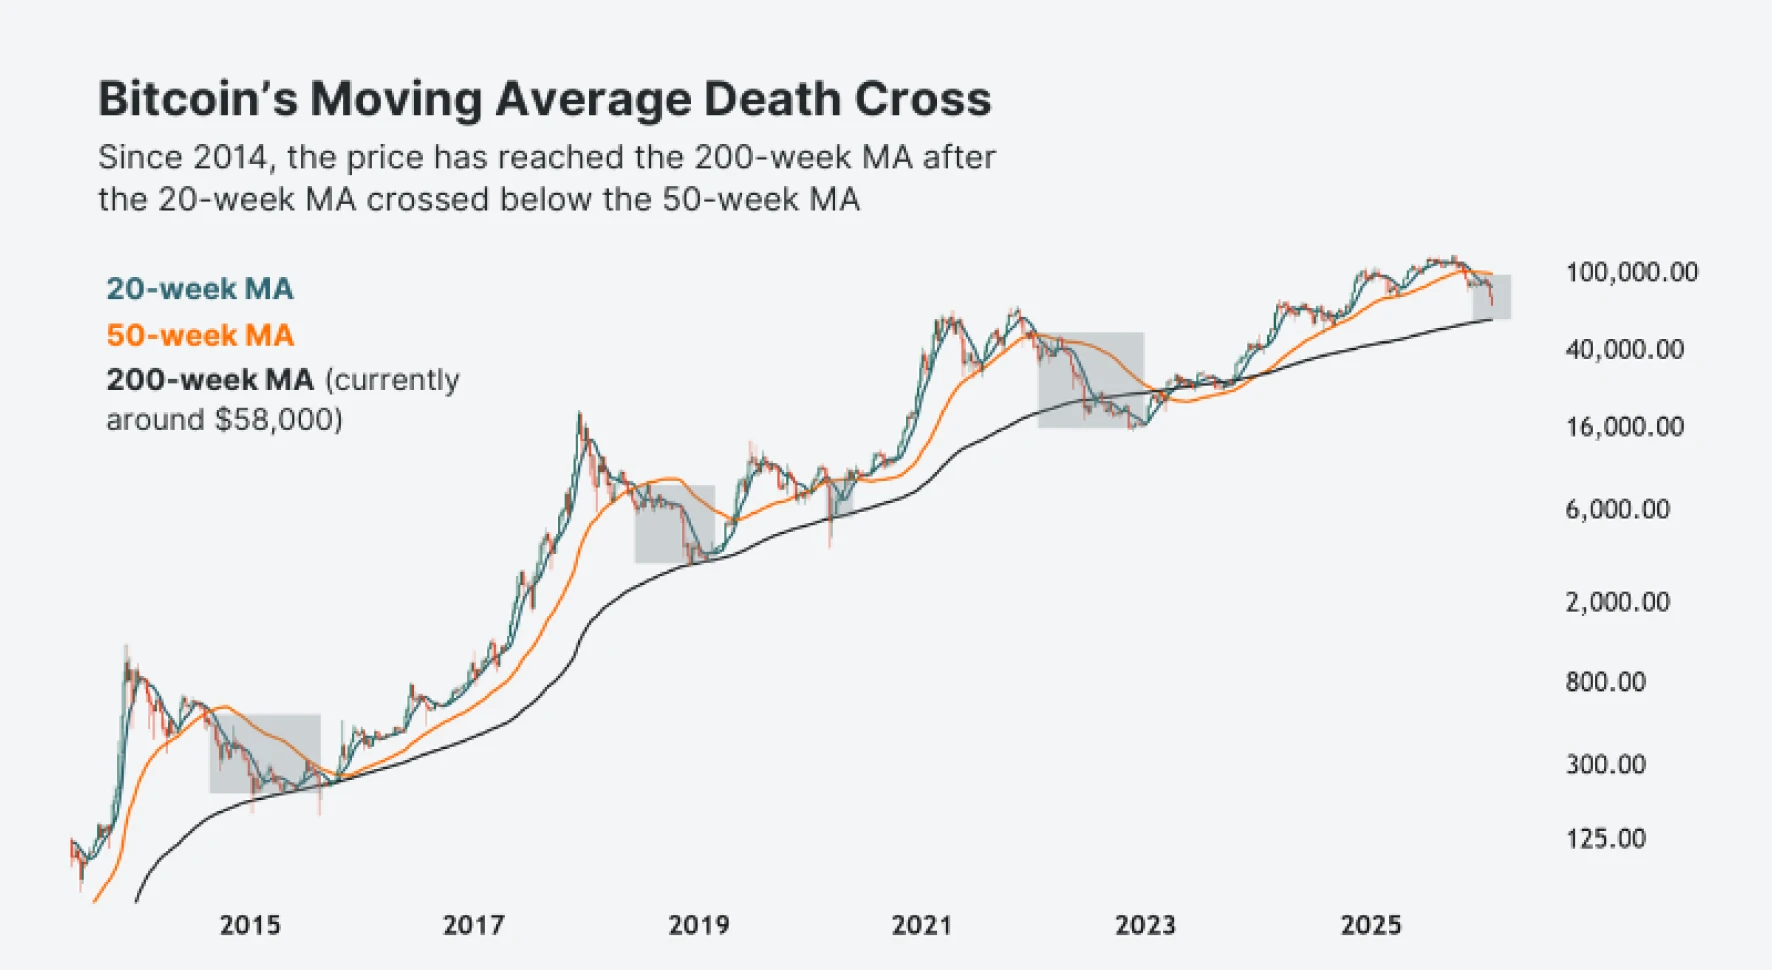
Indicator 1 – Weekly moving averages
 Source: TradingView | As of 5 February, 2026
A death cross happens when a shorter-dated moving average crosses below a longer-dated one. In January, bitcoin had a death cross between the 20-week moving average (MA, teal) and the 50-week MA (orange). That same death cross occurred four prior times since 2014 – with bitcoin later trading down to the 200-week MA (black). The 200-week MA is currently sitting at around $58,000.
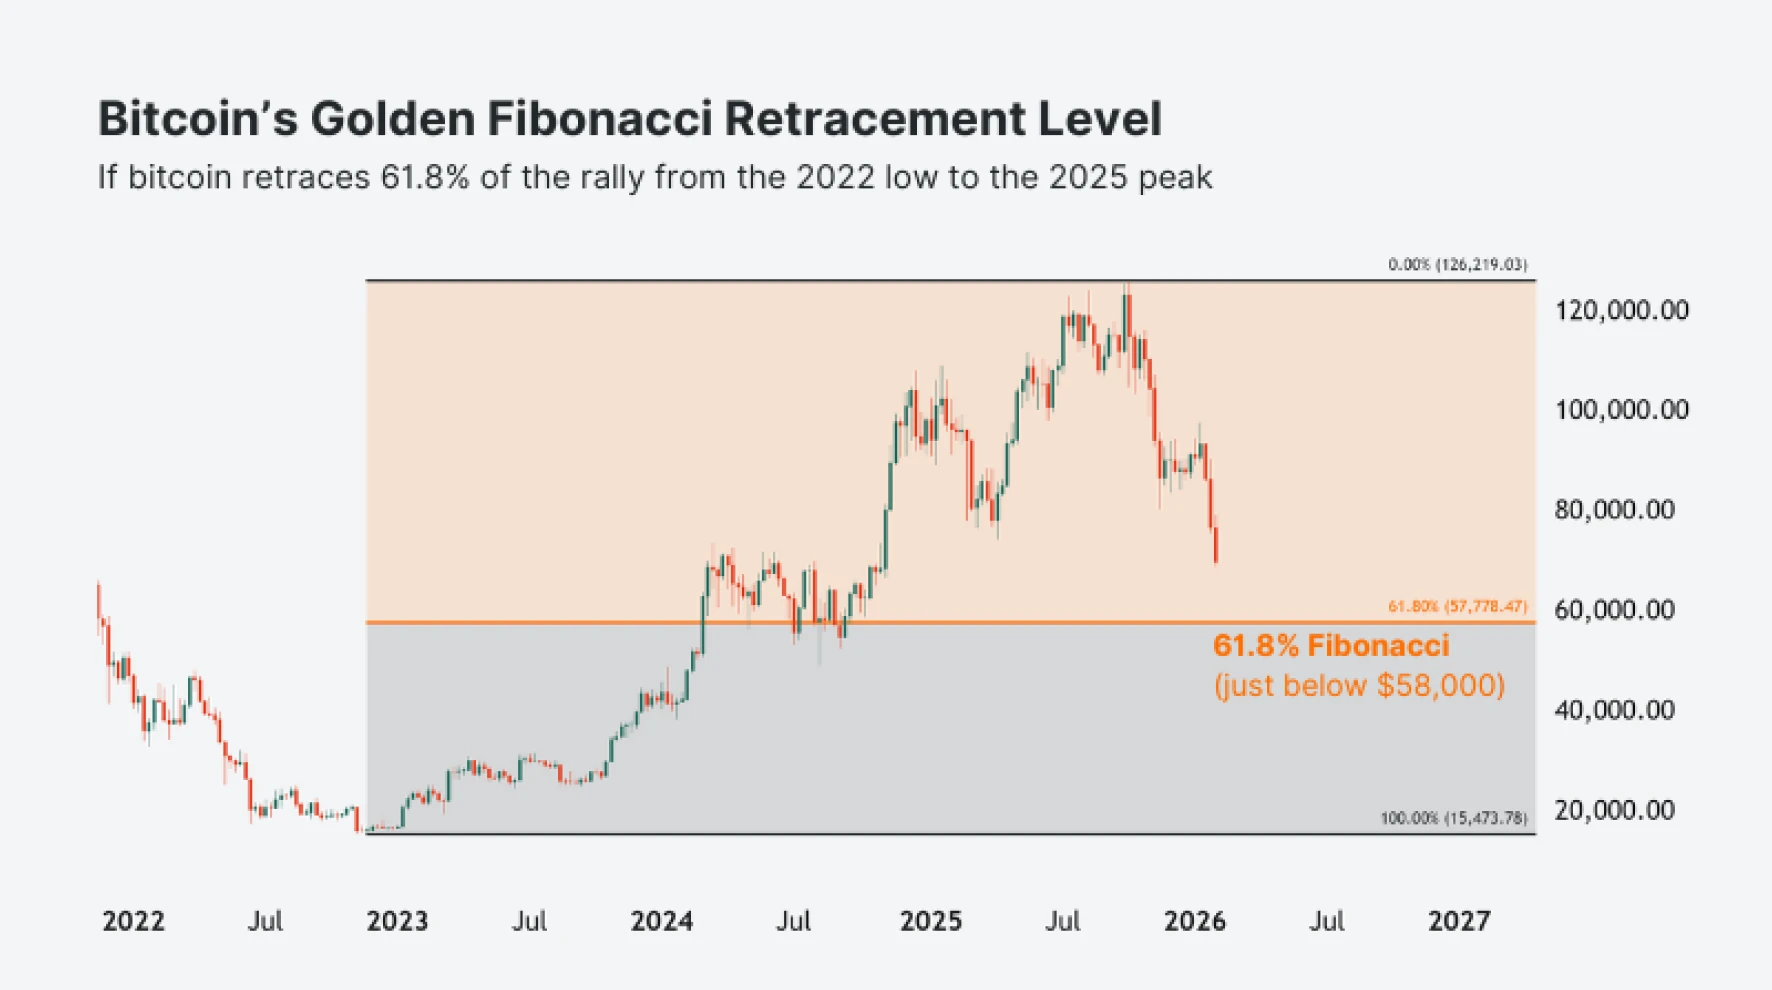
Indicator 2 – 61.8% Fibonacci retracement level
 Source: TradingView | As of 5 February, 2026
Technical crypto traders often watch Fibonacci retracement levels closely – especially the 61.8% “golden” Fibonacci. As the chart shows, this line (in orange) is just below $58,000. If bitcoin were to reach that level, the price would have retraced 61.8% of the rally from the 2022 low to the 2025 peak.
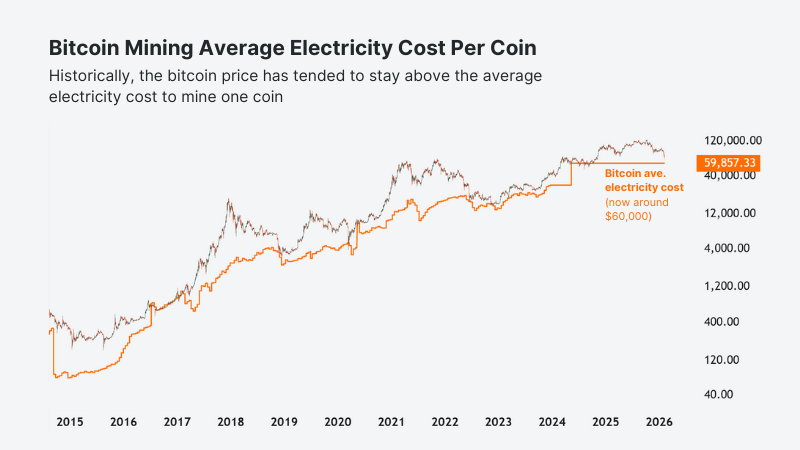
Indicator 3 – Bitcoin Mining Average Electricity Cost
Capriole Investments via TradingView | As of 5 February, 2026
The Bitcoin Production Cost Indicator, by Capriole Investments, measures the average cost for miners to produce one bitcoin. A large subset of that cost is the electricity miners use to mine them. The electricity cost to mine one bitcoin (orange line) has historically coincided with bitcoin value zones. The cost is currently around $60,000.
Leverage Shares offers 3X leveraged long and short bitcoin exchange-traded products.