Bitcoin dropped 35% from early October to mid-November. Since then, it’s had a recovery bounce – and now trades above $90,000 per coin. Here are three charts to help you gauge the trend.
Chart 1: Bitcoin is below its 50-week moving average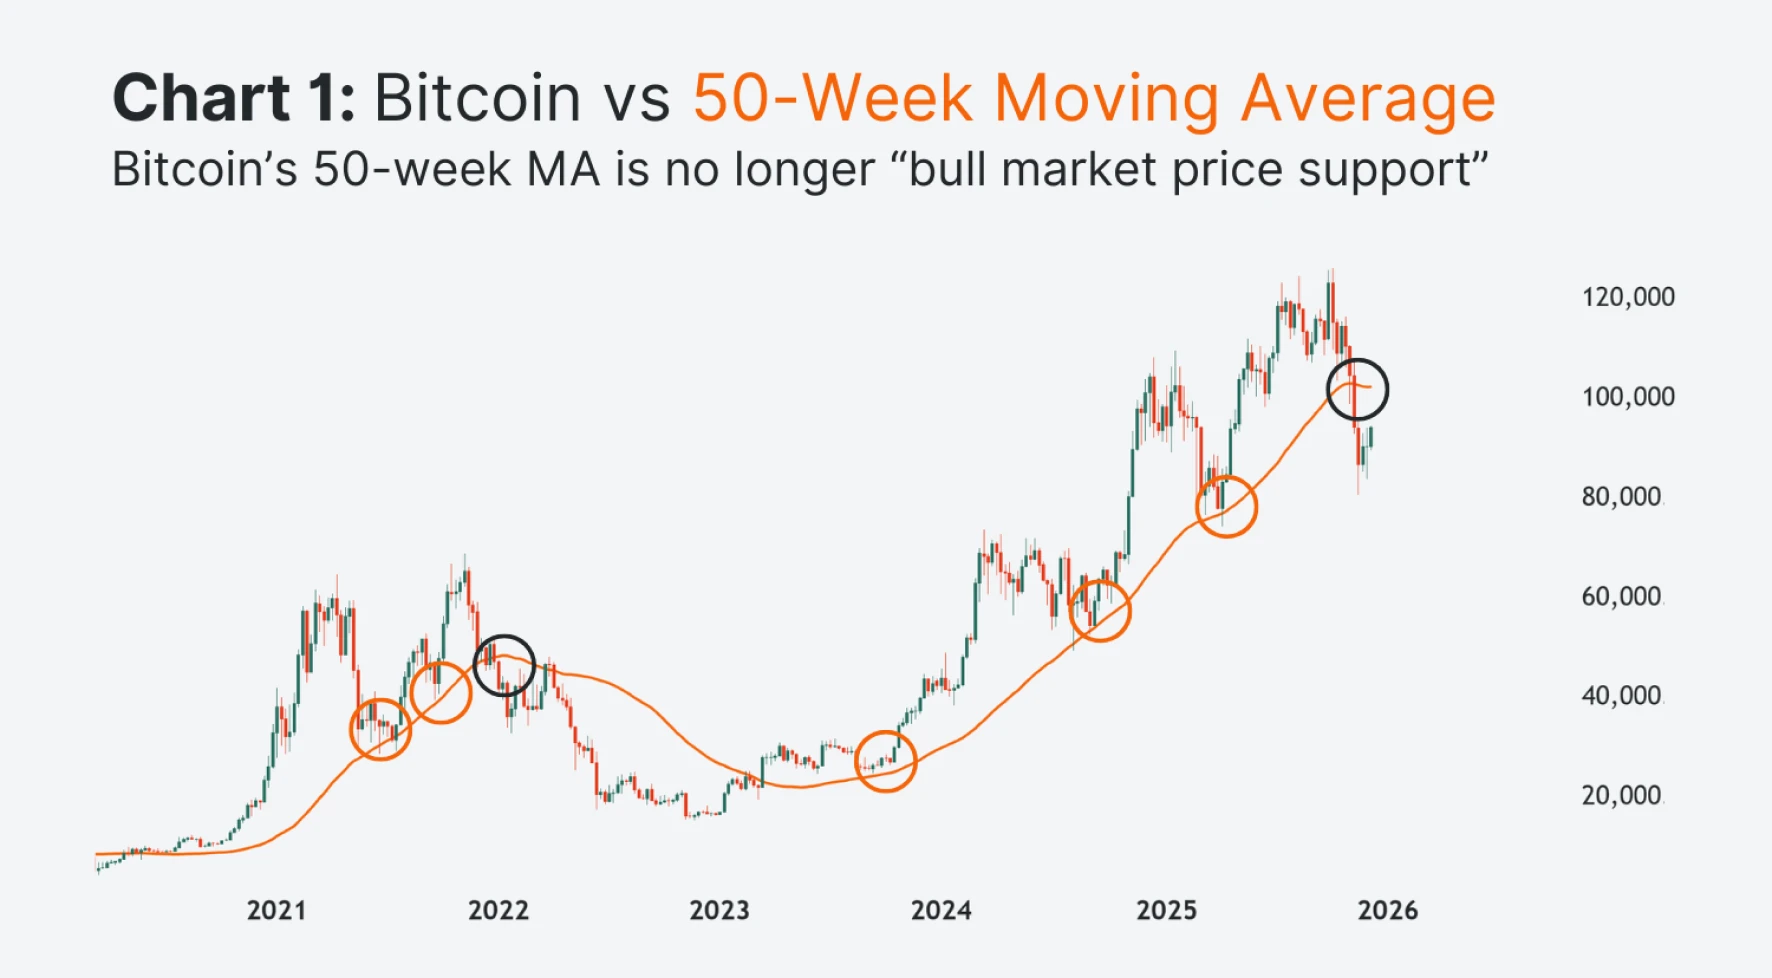
Source: TradingView | As of 9 December, 2025
The 50-week moving average (MA, orange line) tracks the average closing price of bitcoin over the past 50 weeks. Since bitcoin started rallying in early 2023, the 50-week MA has held up the price. That happened in September 2023, August 2024, and April 2025.
But in October, bitcoin dropped below its 50-week MA – and is still trading under it today. The moving average has also started to slope downwards, which shows waning momentum. The line that was once a “support floor” could now become a “resistance ceiling”.
In the last crypto cycle, that setup led to a longer bear market – with bitcoin unable to reclaim the 50-week MA. That doesn’t mean the same thing will happen now. But unless bitcoin can reclaim it this time, sellers technically have the upper hand.
Chart 2: Bitcoin’s weekly RSI has hidden bullish divergence potential
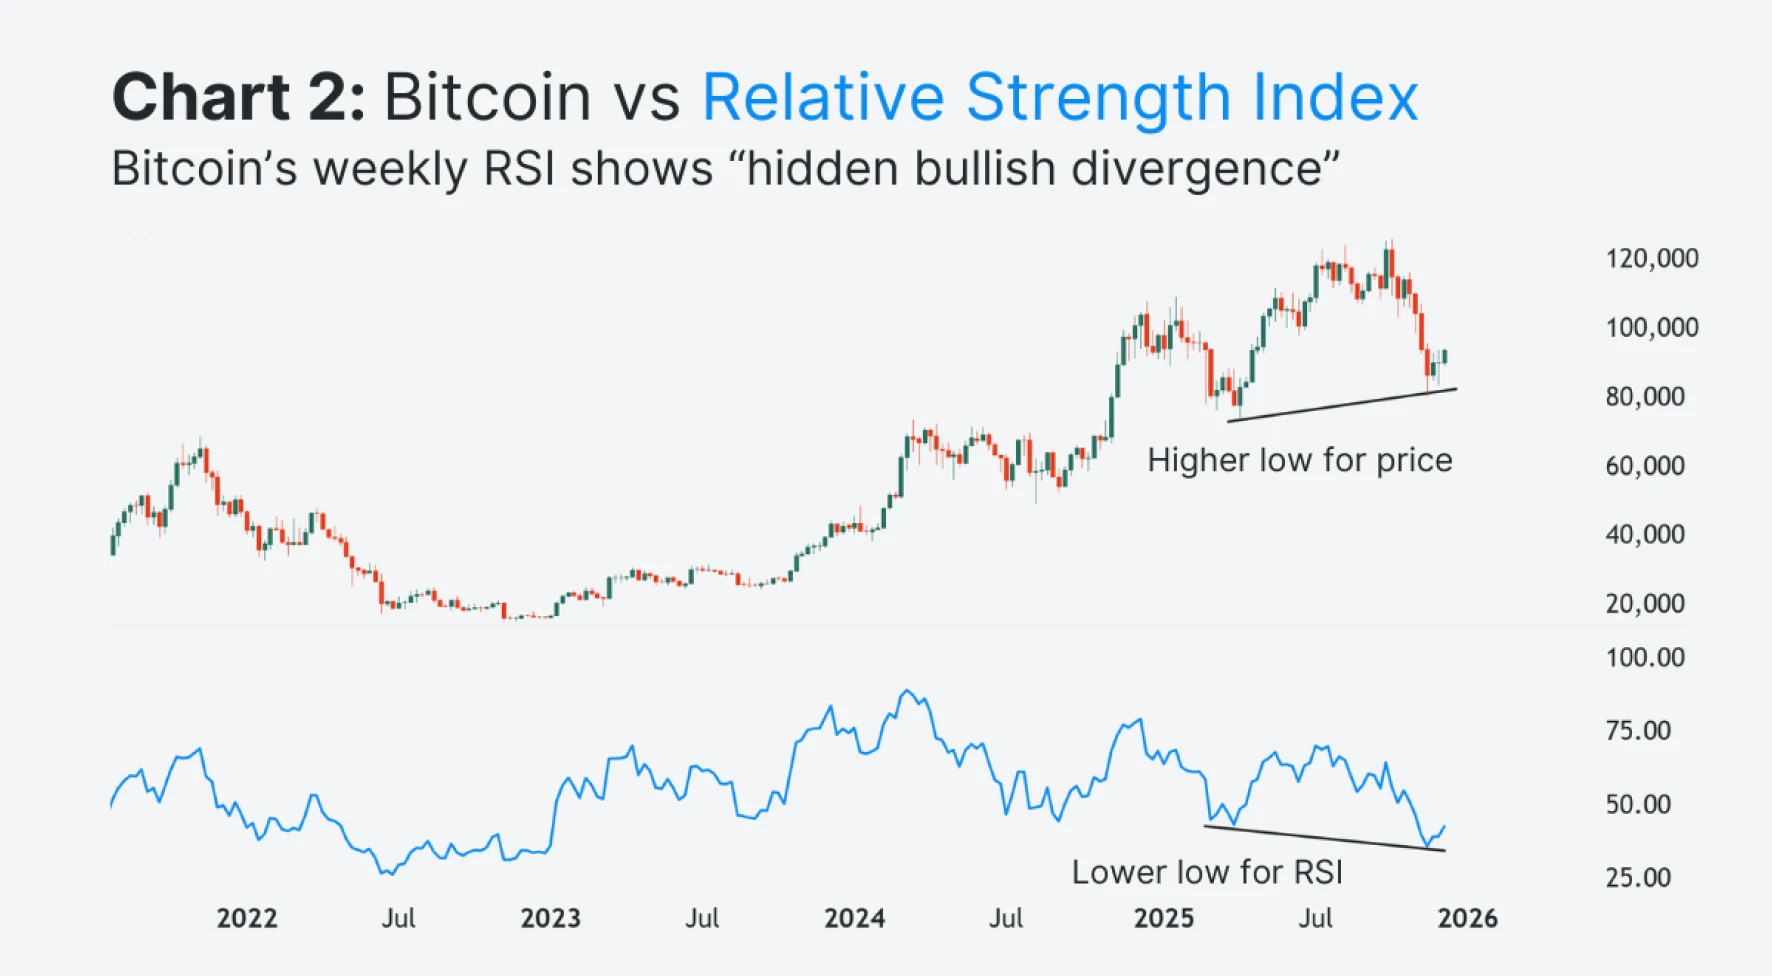
Source: TradingView | As of 9 December, 2025
The relative strength index (RSI, blue) measures the relative strength of buying pressure versus selling pressure, over the past 14 weeks. When it drops, the average losses of “down weeks” grow relative to the average gains of “up weeks”.
The chart shows that bitcoin's weekly RSI has come down this year: it’s now lower than in April. Meanwhile, bitcoin’s price is potentially forming a higher low – meaning there could be hidden bullish divergence.
So selling pressure has increased (according to the indicator), but the price is still above its April low. Technically, that could be a sign that sellers are running out of steam, and bitcoin could be due for a more prolonged bounce over the coming weeks.
Chart 3: Bitcoin’s 50% retracement is near $100,000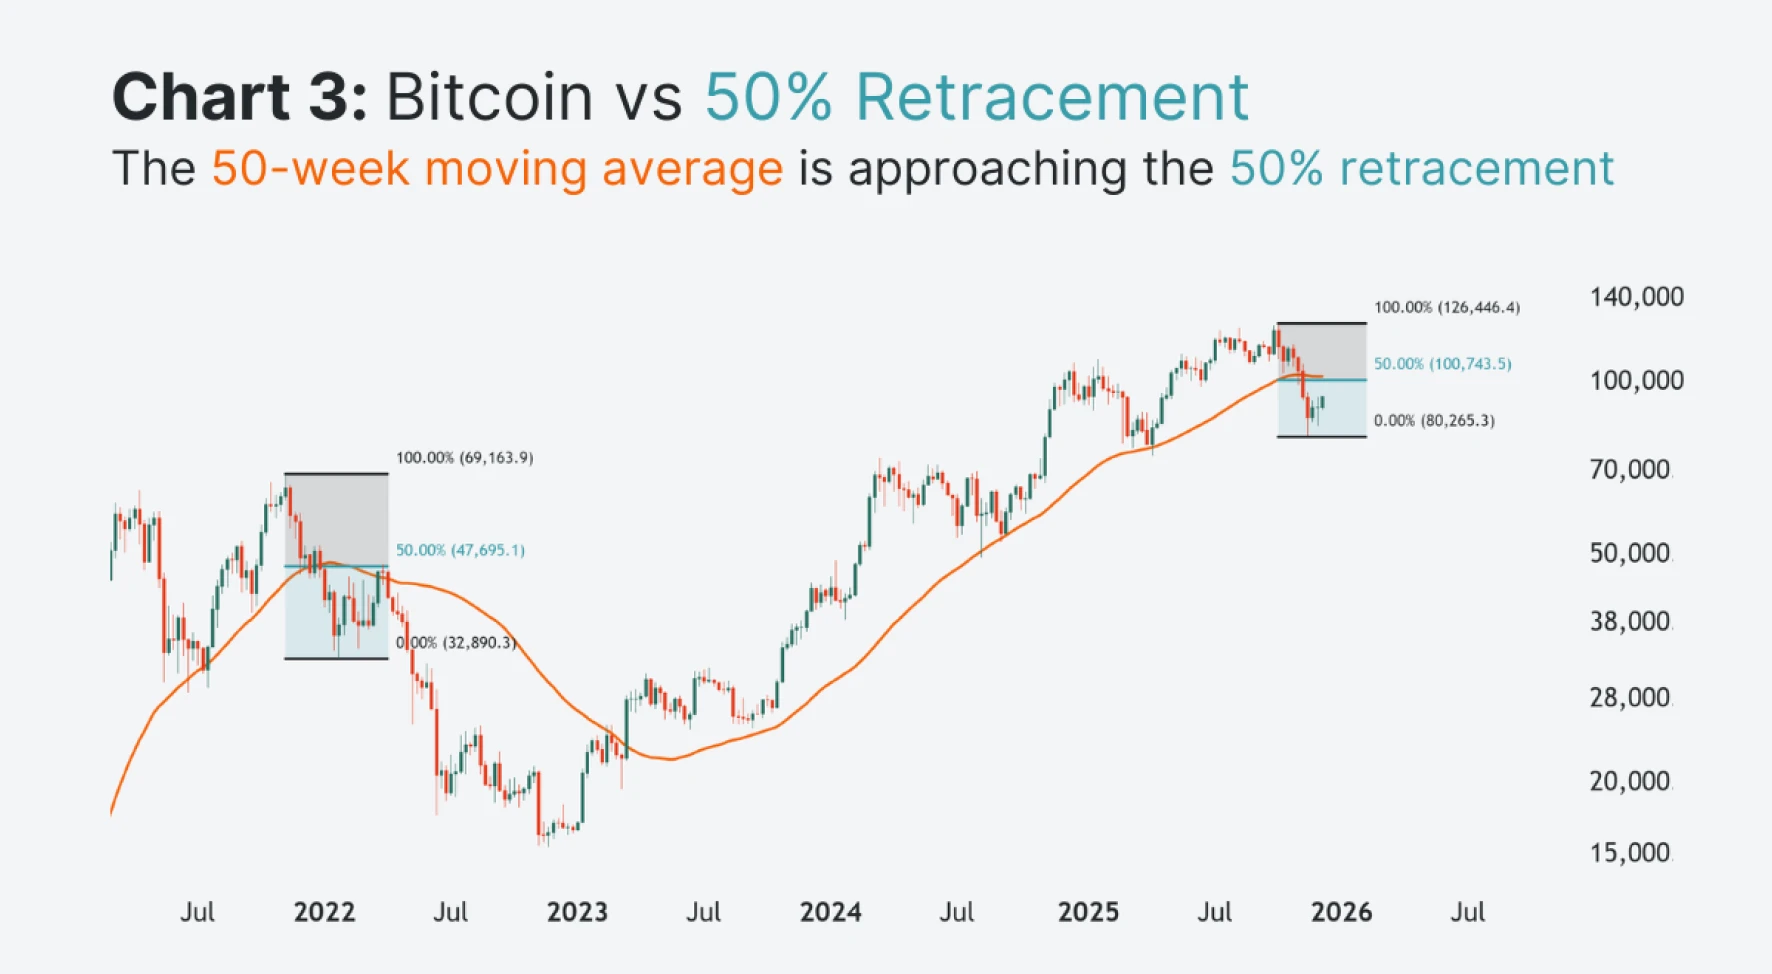
Source: TradingView | As of 9 December, 2025
If bitcoin does bounce further from here, the bulls won’t be out of the woods yet – there’s still potential resistance above. The 50% retracement level (teal) is just above $100,000. If bitcoin were to reach that mark, it would’ve recovered 50% of its drop from October. That’s also confluent with the 50-week MA.
Traders tend to watch the 50% retracement heavily. In the last cycle, that’s where bitcoin was rejected. If you’re bullish on bitcoin, you don’t want to see the same pattern repeat.
LeverageShares offers 3X long and short bitcoin ETPs.
Key takeaways
Bitcoin is trading below its 50-week moving average, which now slopes downward and may act as resistance.
Bitcoin’s weekly RSI shows hidden bullish divergence, hinting at a possible short-term bounce.
The 50% retracement near $100,000 aligns with the 50-week MA. It could be a key resistance zone if price rallies further.