Bitcoin's 50-week moving average has divided its bull and bear markets for over a decade. Bitcoin is now retesting that line for the first time since September – and so far, it's holding. As long as weekly candles keep closing above it, the bull market case stays intact.
Why the bitcoin 50-week moving average is the line in the sand
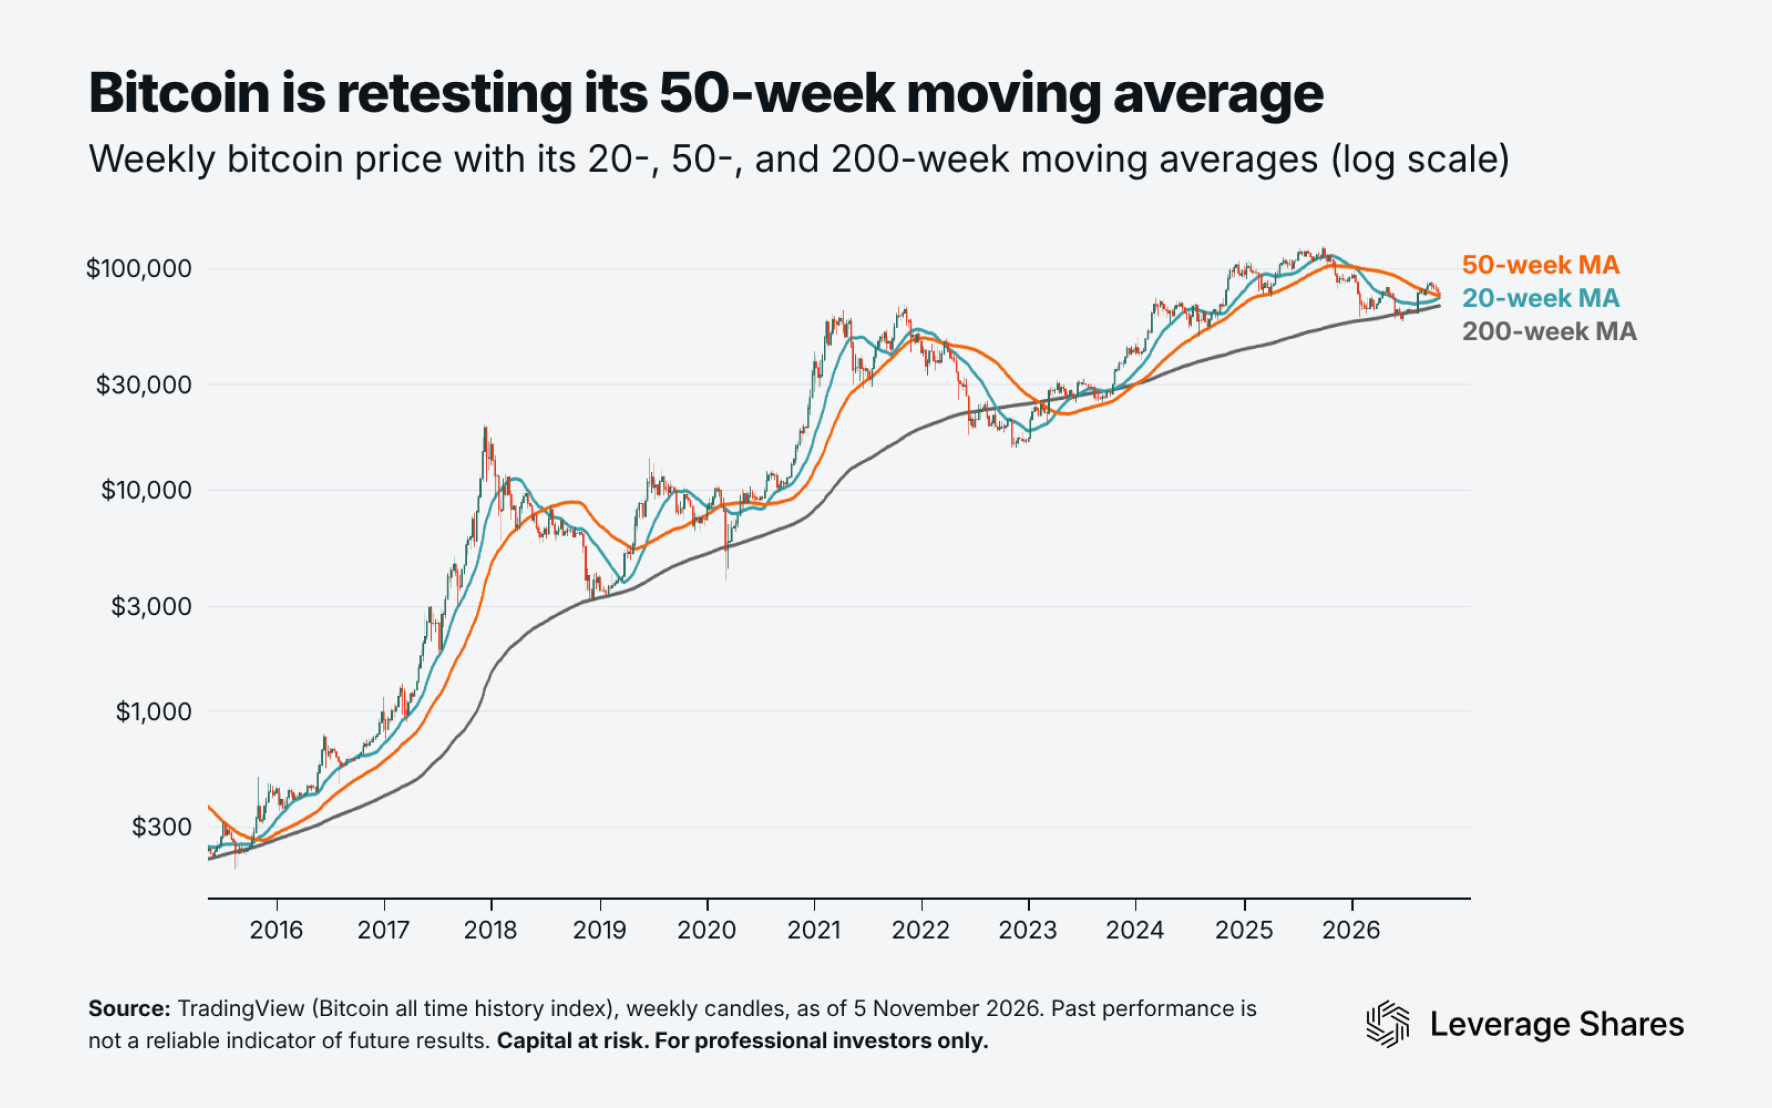
The 50-week moving average (orange) is bitcoin's average weekly closing price over the past 50 weeks – roughly a year. Each candle in the chart shows one week of trading. From March 2023, bitcoin closed 139 weeks in a row above the line – the longest streak in its history. The previous record was 135 weeks, from October 2015 to May 2018.
The price did dip below it during the week in August 2024 and April 2025. But both times, buyers pushed bitcoin back above it by the weekly close. That's why traders judge the line on weekly closes.
The streak ended in November 2025, and bitcoin stayed below the line for most of the next year. Then in September, it closed the week back above the 50-week for the first time since.
The 50-week moving average is still sloping down, and it's now around $75,600. Bitcoin dipped to it in each of the past two weeks, and buyers stepped in both times.
But this week’s bounce has already faded, and bitcoin is pulling back hard toward the line again. A mid-week drop like this doesn’t decide anything on its own, because the weekly close is what counts. As long as the week closes above the 50-week, the line is still holding.
Meanwhile, the faster 20-week moving average (blue) is rising toward the 50-week from below. When a faster average rises toward a slower one, it tends to signal improving upward price momentum.
Just keep in mind that a weekly close below the 50-week wouldn't automatically mean a new bear market. But it could mean a longer sideways range. The 200-week moving average (grey) is currently at around $68,000.
Leverage Shares offers 3X long and short Bitcoin ETPs, which aim to provide three times the daily move in bitcoin, before fees. Capital at risk.
Key takeaways
- The bitcoin 50-week moving average is its average weekly close over roughly a year. It has divided bitcoin's bull and bear markets for over a decade.
- Bitcoin closed 139 weeks in a row above it from March 2023 to November 2025. It dipped below the line mid-week, but never closed a week under it.
- Bitcoin is now retesting the line near $75,600 for the first time since September. A weekly close below it could signal a longer sideways range.