Bitcoin and Ethereum both made two lows in February. But the most recent lows look different. Volatility has dropped, selling pressure appears weaker, and the ETH/BTC weekly chart is sitting on long-term support. Here are three charts that show what's changed – and whether buyers could be regaining control.
Bitcoin: buyers held up better on the second low
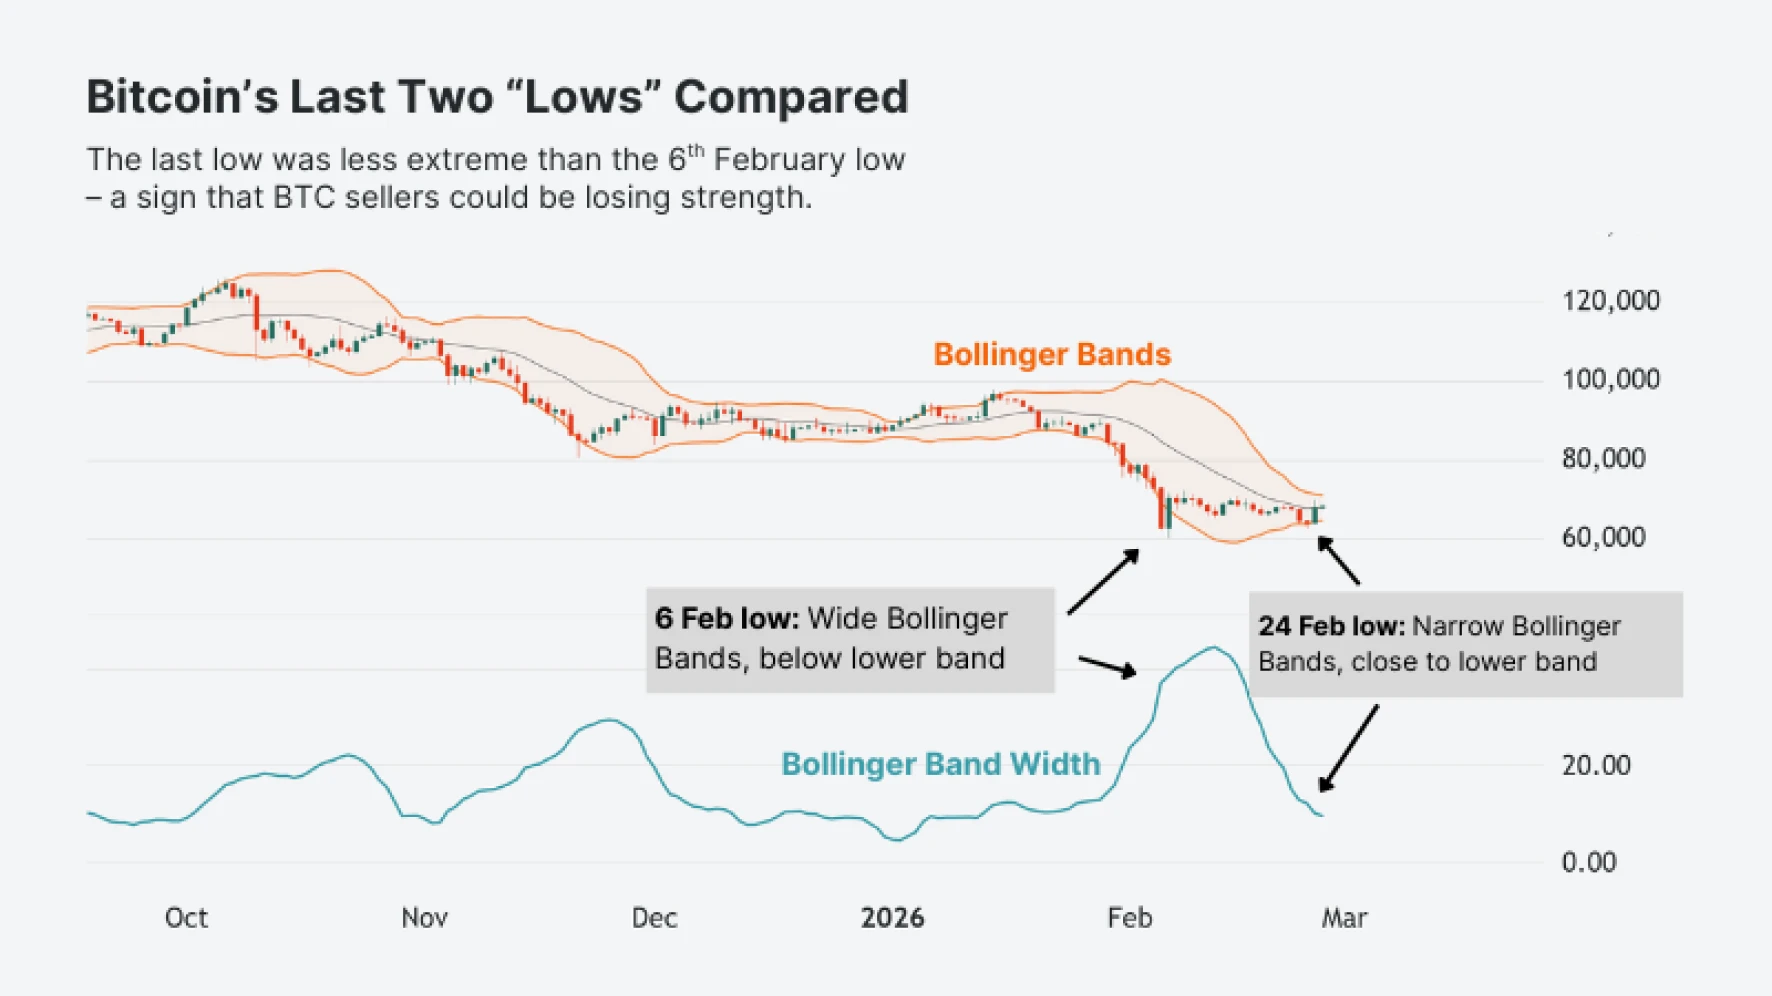
The chart below shows bitcoin's weekly candlesticks with Bollinger Bands and the Bollinger Band Width indicator.
Source: TradingView | As of 26 February, 2026
Bollinger Bands measure volatility. When the bands widen, it means the price is moving more than usual. When they narrow, volatility is dropping.
On 6 February, bitcoin fell below the lower Bollinger Band. The bands were wide at the time, and the Band Width indicator spiked higher. That's a sign of extreme selling pressure – the kind of move that only happens around 11% of the time, according to research by John Bollinger himself.
The 24 February low was different. The Bollinger Bands had narrowed, and the price stayed close to the lower band rather than breaking below it. The Band Width indicator was lower too.
In plain English: the first low was a panic sell-off with extreme volatility. The second low was calmer. Sellers didn't have enough pressure to force another extreme move. That can be an early sign that buyers are starting to absorb the selling – though it doesn't guarantee a reversal.
Ethereum: the same shift from sellers to buyers
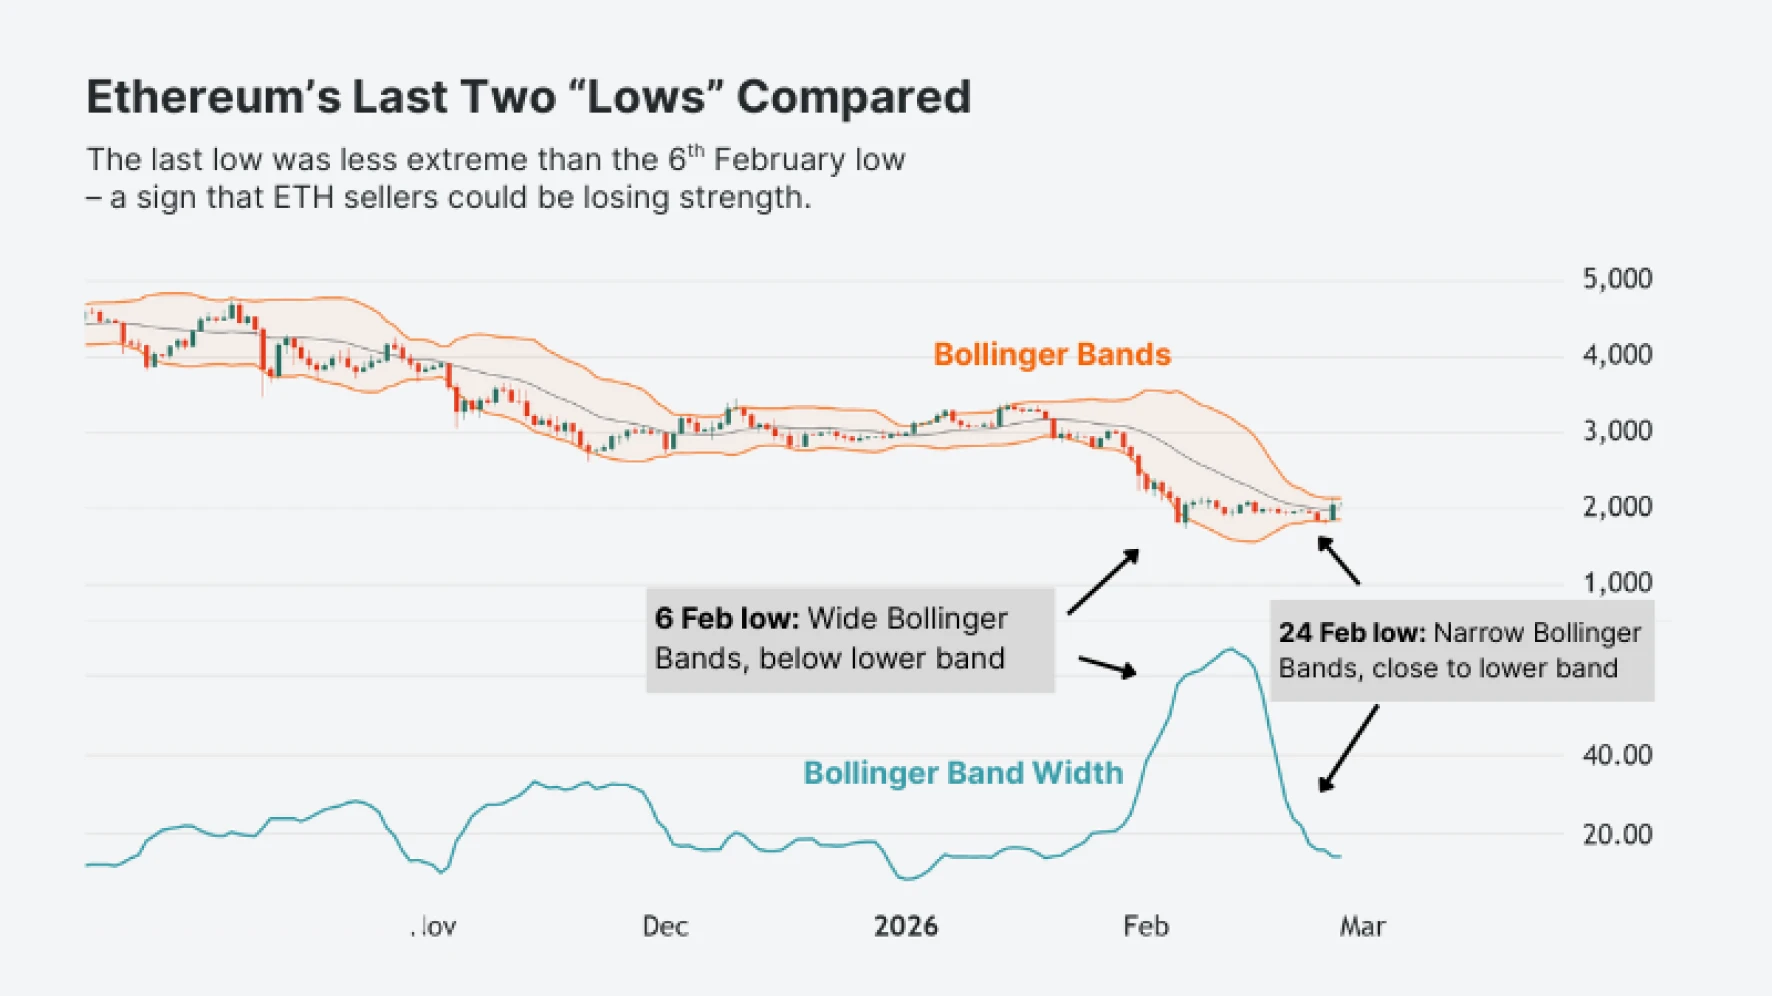
Ethereum's weekly chart tells a similar story.
Source: TradingView | As of 26 February, 2026
On 6 February, ETH dropped below its lower Bollinger Band with wide bands and a high Band Width reading. It was a volatile, high-fear move.
By 24 February, the bands had tightened. ETH touched the lower band but didn't break below it. The Band Width indicator fell back too.
The pattern matches bitcoin: a less volatile second low, with sellers unable to match the force of the first drop. Both assets showing the same signal suggests sell pressure could be fading across the broader crypto market. Buyers aren't in control yet, but they're putting up more resistance than they did in early February.
ETHBTC: a potential sign of rising risk appetite
The ETH/BTC ratio tracks how ETH performs relative to BTC. When the ratio rises, ETH gains value compared to BTC. When it falls, bitcoin leads.
ETH tends to be the higher-risk, higher-volatility asset of the two. So when money starts rotating from BTC into ETH, it can be a sign that investors are more willing to take risk. A rising ETH/BTC ratio has often coincided with broader crypto rallies – periods when capital flows into riskier assets.
Source: TradingView | As of 26 February, 2026
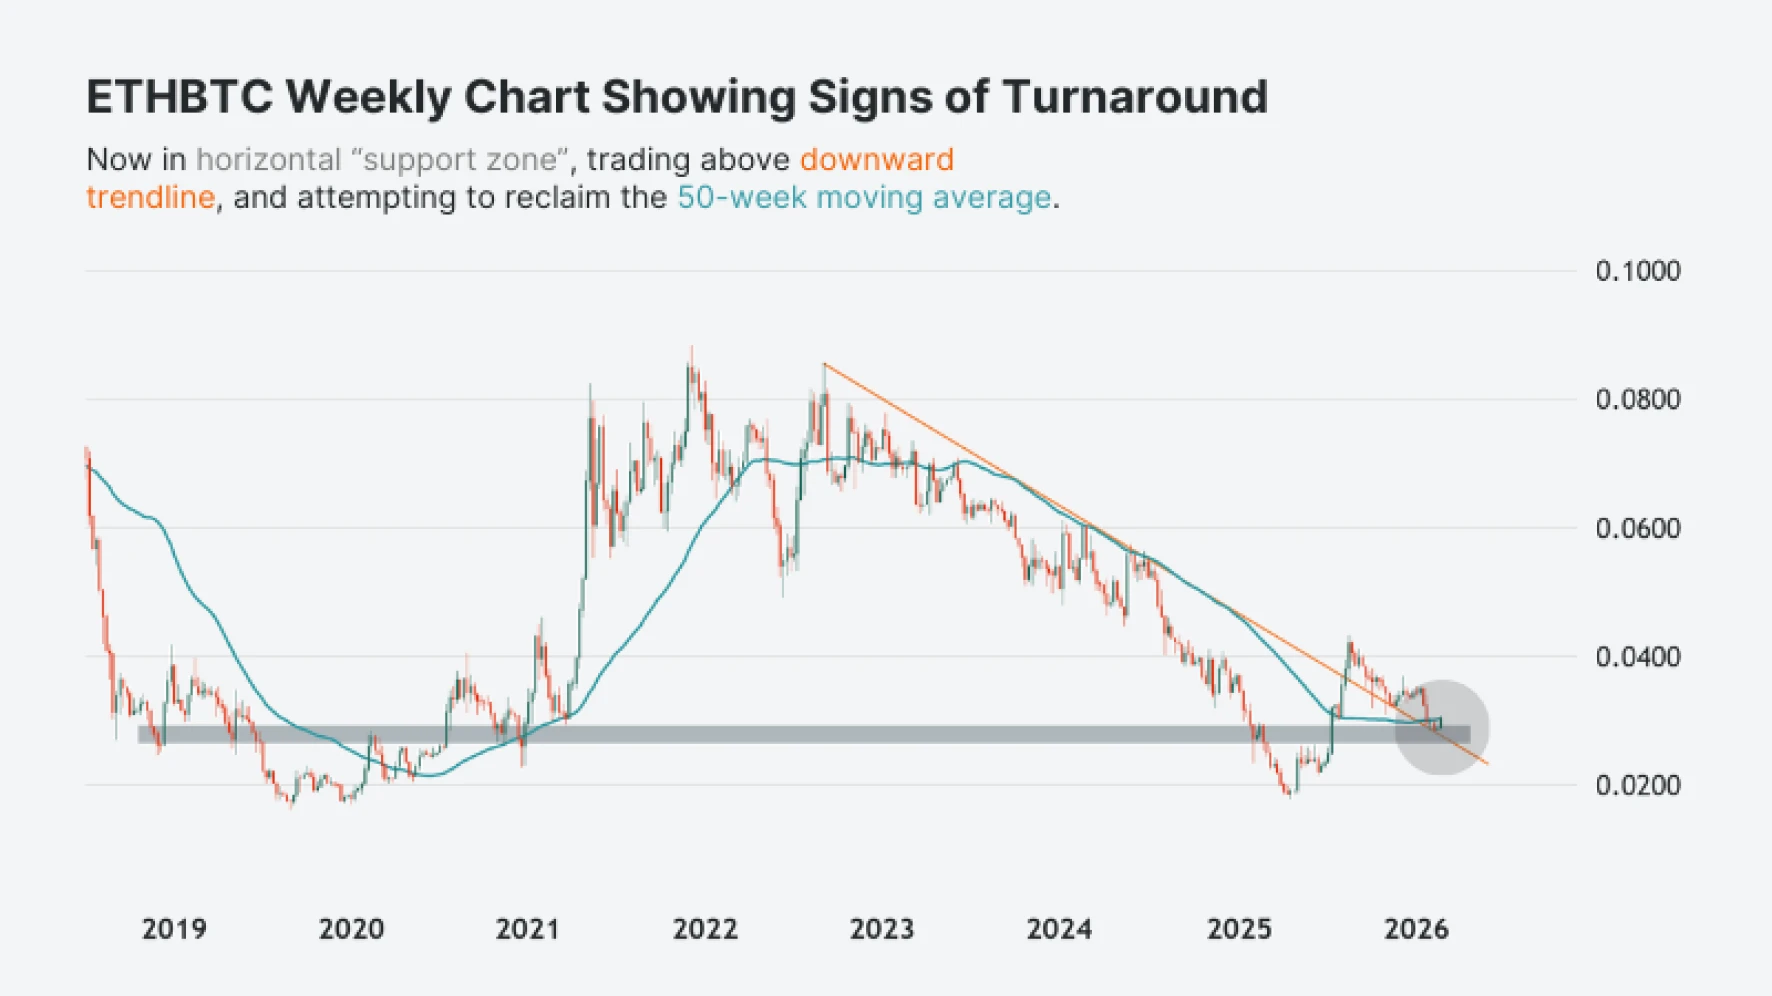
This weekly chart goes back to 2019. The ratio has been in a downtrend since late 2021, meaning BTC has outperformed ETH for years. But a few things stand out at current levels.
First, the ETH/BTC ratio is sitting inside a horizontal support zone (grey) that held during the 2020 low. Buyers stepped around this level before.
Second, the price has moved above the downward trendline (orange) that defined the sell-off since 2022. This could be an early sign that selling pressure is fading.
Third, the ratio is attempting to reclaim its 50-week moving average (blue). If it closes above that line, it could signal a shift in momentum from BTC back toward ETH.
If this ratio turns higher, it could back up what the BTC and ETH charts already show: sell pressure is fading on both assets. And money rotating toward the riskier one could mean confidence is coming back into crypto.
Leverage Shares offers 3X long and short ETPs for both Bitcoin and Ethereum, allowing investors to gain amplified exposure to daily moves.
Key takeaways
Bitcoin and Ethereum both made a less volatile second low in late February compared to early February. The Bollinger Bands narrowed, and neither asset broke below the lower band – a potential sign that buyers are absorbing sell pressure.
The ETH/BTC weekly chart is near horizontal support that dates back to 2021, with the price now trading above its multi-year downward trendline. A turn higher in this ratio could reflect rising risk appetite across crypto.
If the ETH/BTC ratio reclaims the 50-week moving average, it could signal a broader shift in market sentiment. But the ratio could also fail at this level, as it has done before.